USDCAD Outlook
USD/CAD Weekly Outlook
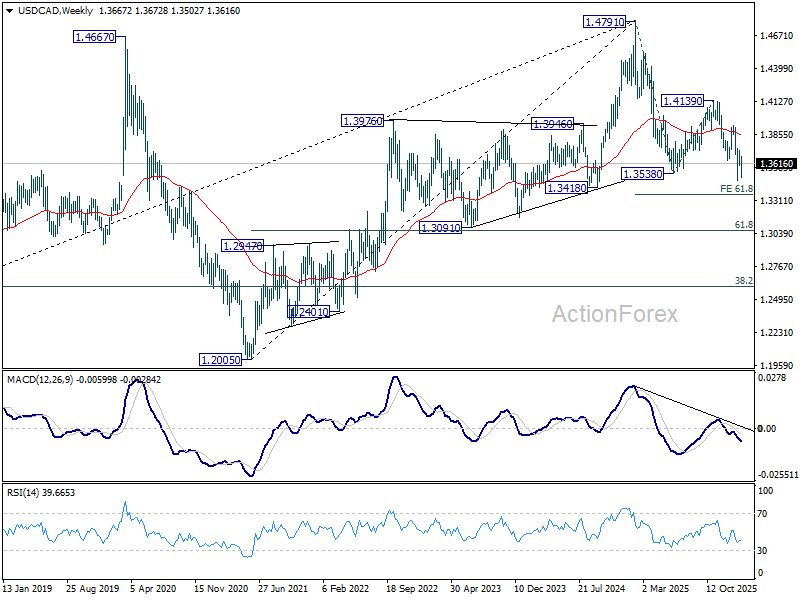
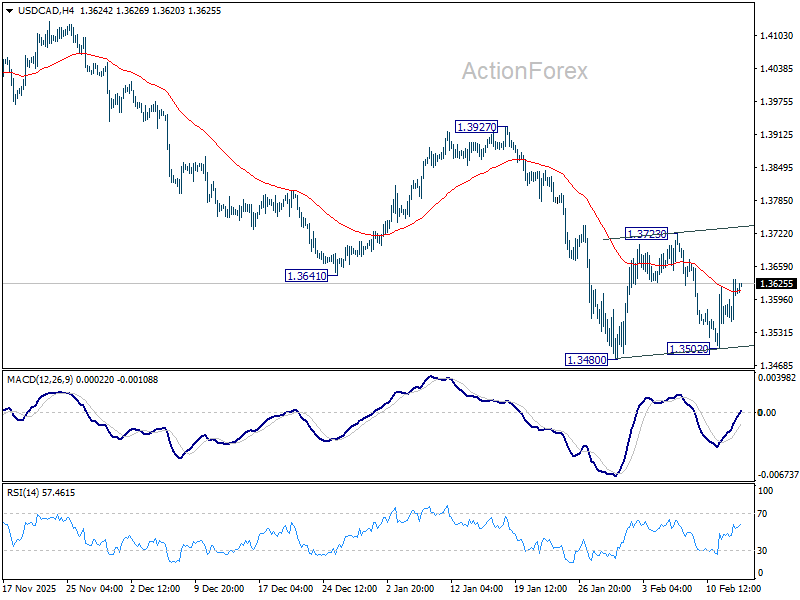
USD/CAD extended the consolidation pattern from 1.3480 last week. Initial bias stays neutral this week first. While stronger rebound cannot be ruled out, upside should be limited by 55 D EMA (now at 1.3752) to complete the pattern. On the downside, firm break of 1.3480 will resume larger down trend from 1.4791 to 61.8% projection of 1.4791 to 1.3538 from 1.4139 at 1.3365.
In the bigger picture, price actions from 1.4791 are seen as a corrective pattern to the whole up trend from 1.2005 (2021 low). Deeper fall could be seen as the pattern extends, to 61.8% retracement of 1.2005 to 1.4791 at 1.3069. For now, medium term outlook will be neutral at best, until there are signs that the correction has completed, or that a bearish trend reversal is confirmed.
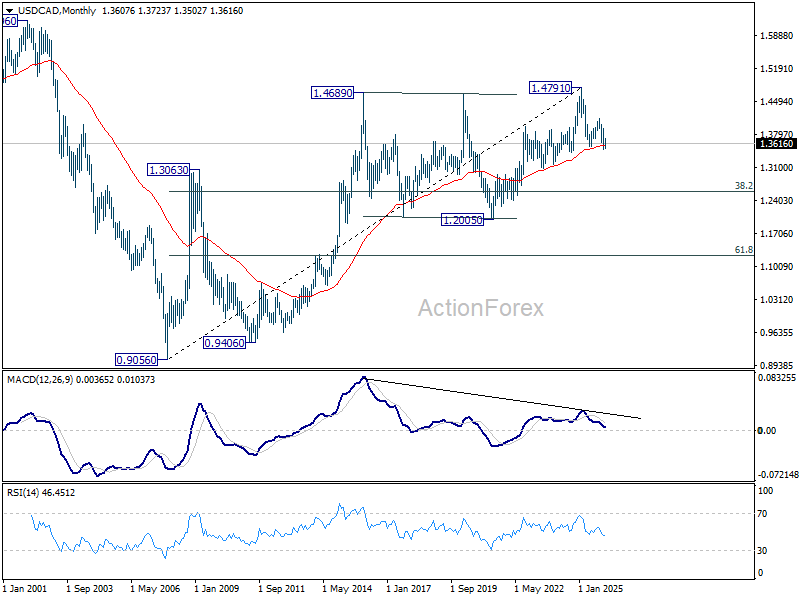
In the long term picture, rising 55 M EMA (now at 1.3569) remains intact. Thus, up trend from 0.9056 (2007 low) should still be in progress. However, considering bearish divergence condition M MACD, sustained trading below 55 M EMA will argue that the up trend has completed with five waves up to 1.4791, and turn medium term outlook bearish for correction to 38.2% retracement of 0.9056 to 1.4791 at 1.2600.
USD/CAD Daily Outlook
Daily Pivots: (S1) 1.3564; (P) 1.3600; (R1) 1.3644; More...
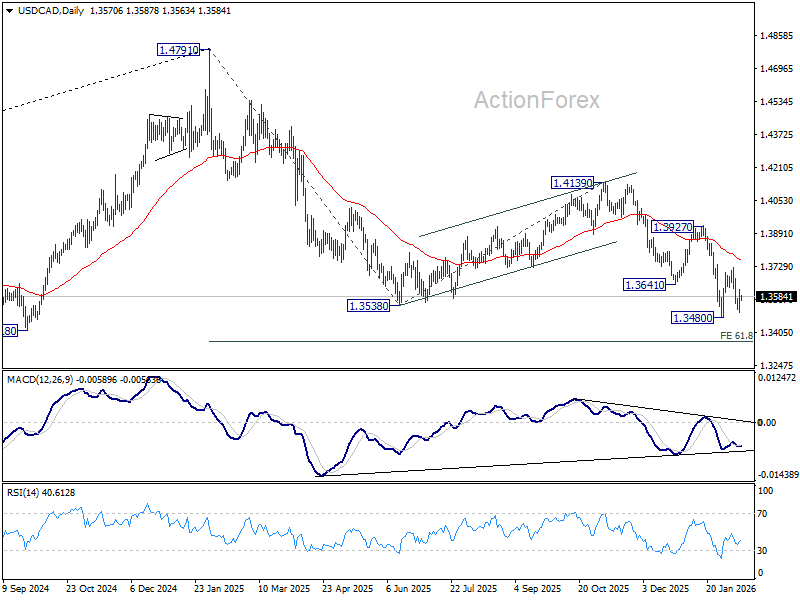
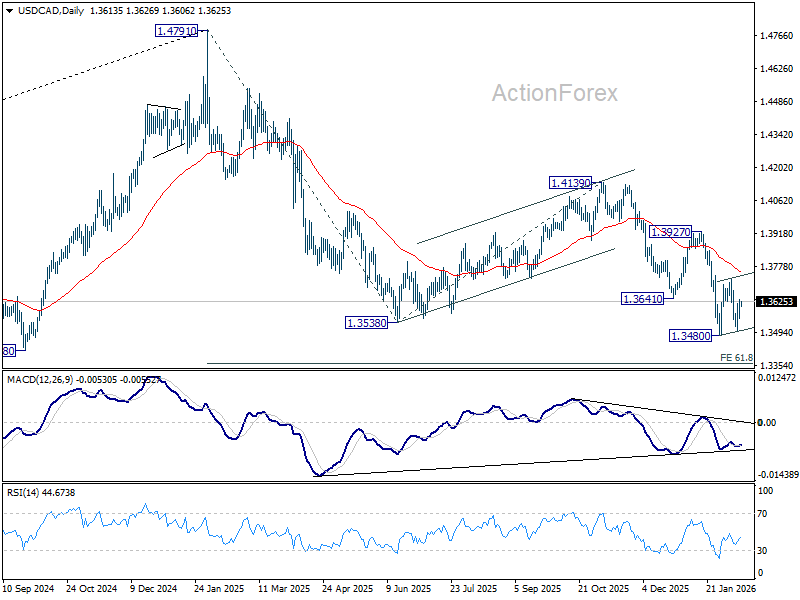
USD/CAD is extending the consolidation pattern from 1.3480 and intraday bias stays neutral. Strong rebound cannot be ruled out, but upside should be limited by 55 D EMA (now at 1.3757). On the downside, break of 1.3480 low will resume larger down trend from 1.4791 to 61.8% projection of 1.4791 to 1.3538 from 1.4139 at 1.3365.
In the bigger picture, price actions from 1.4791 are seen as a corrective pattern to the whole up trend from 1.2005 (2021 low). Deeper fall could be seen as the pattern extends, to 61.8% retracement of 1.2005 to 1.4791 at 1.3069. For now, medium term outlook will be neutral at best, until there are signs that the correction has completed, or that a bearish trend reversal is confirmed.
USD/CAD Daily Outlook
Daily Pivots: (S1) 1.3515; (P) 1.3567; (R1) 1.3630; More...
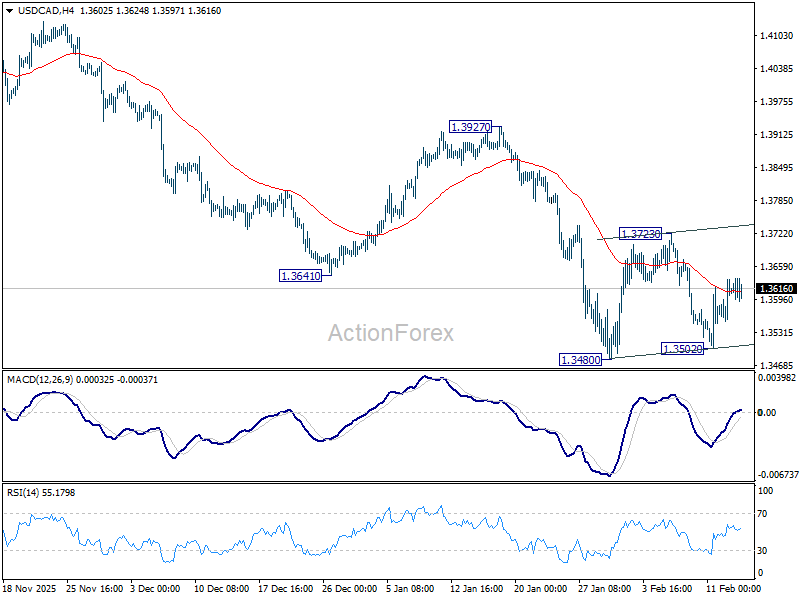
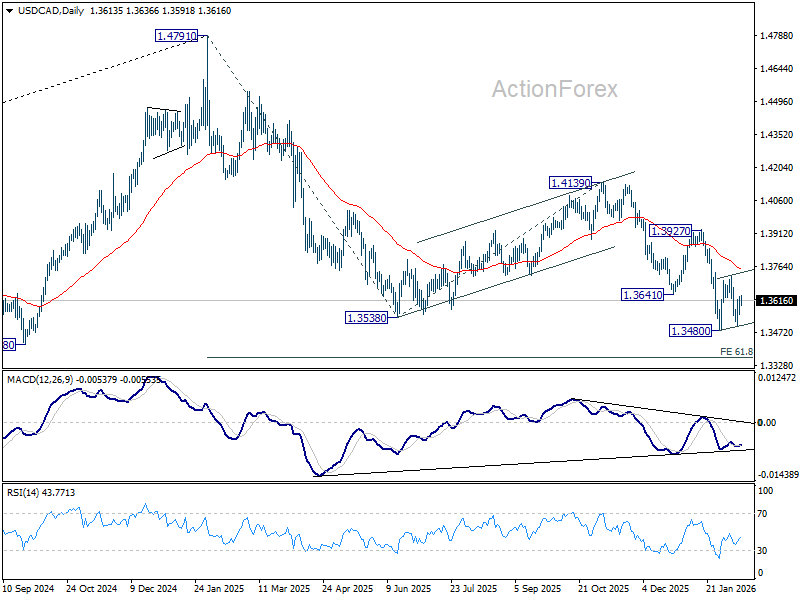
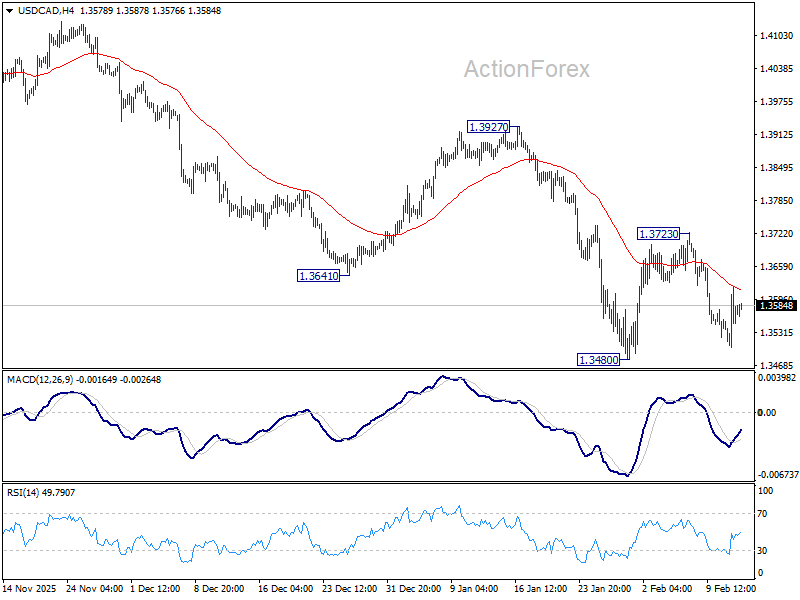
Intraday bias in USD/CAD is neutral for the moment as consolidation pattern from 1.3480 is extending. Strong rebound cannot be ruled out, but upside should be limited by 55 D EMA (now at 1.3757). On the downside, break of 1.3480 low will resume larger down trend from 1.4791 to 61.8% projection of 1.4791 to 1.3538 from 1.4139 at 1.3365.
In the bigger picture, price actions from 1.4791 are seen as a corrective pattern to the whole up trend from 1.2005 (2021 low). Deeper fall could be seen as the pattern extends, to 61.8% retracement of 1.2005 to 1.4791 at 1.3069. For now, medium term outlook will be neutral at best, until there are signs that the correction has completed, or that a bearish trend reversal is confirmed.