GBP/USD Mid-Day Outlook

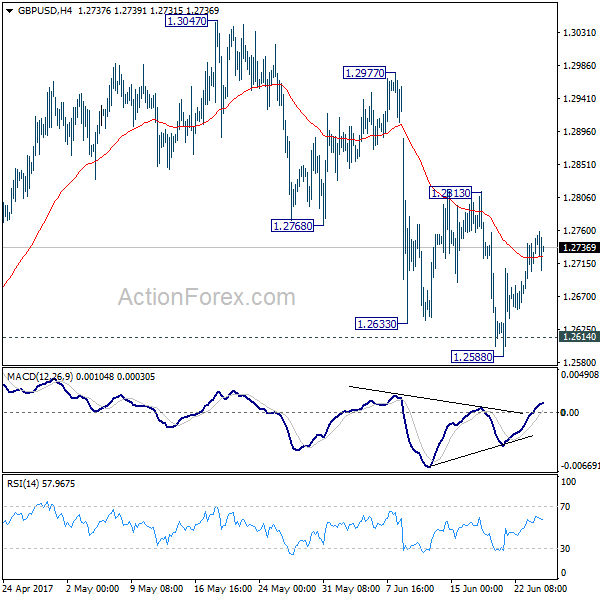
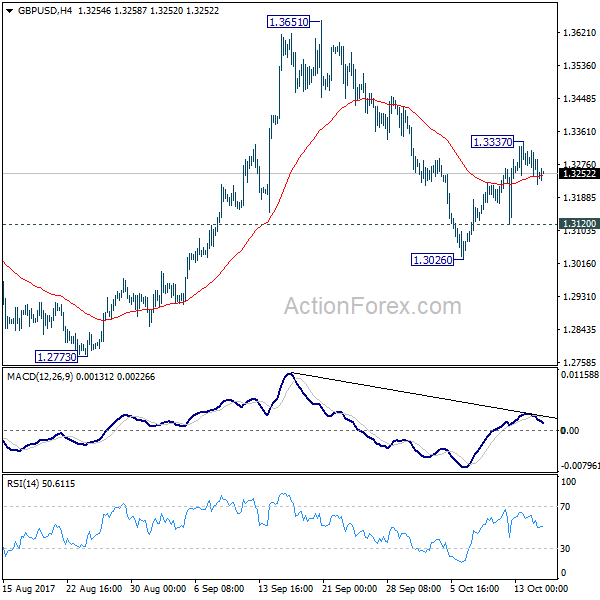
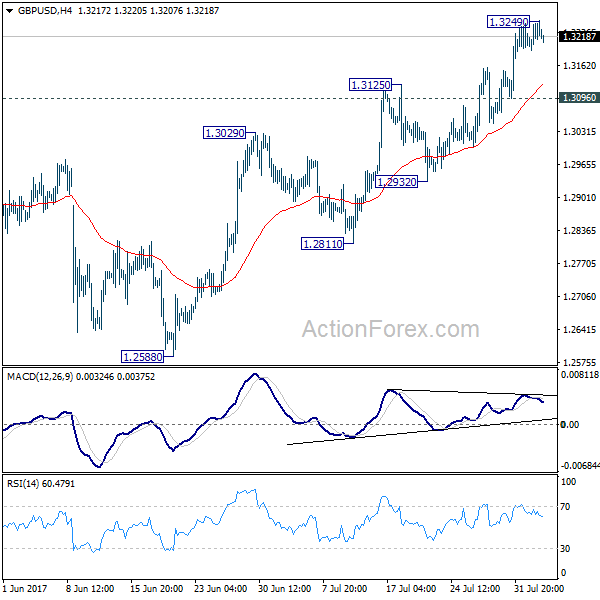
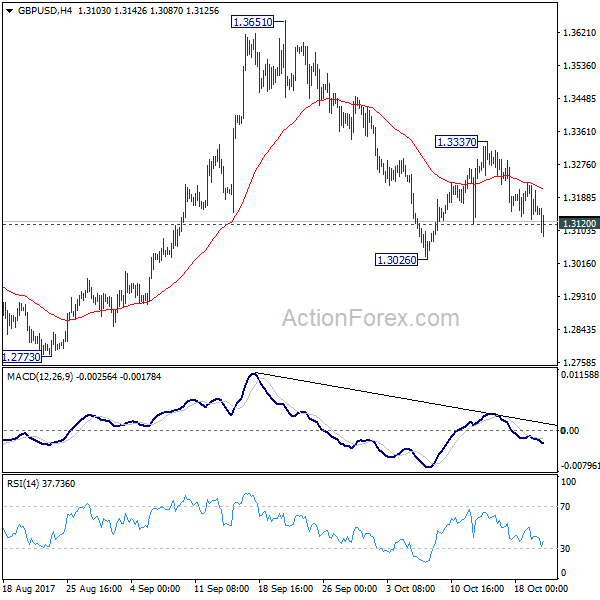
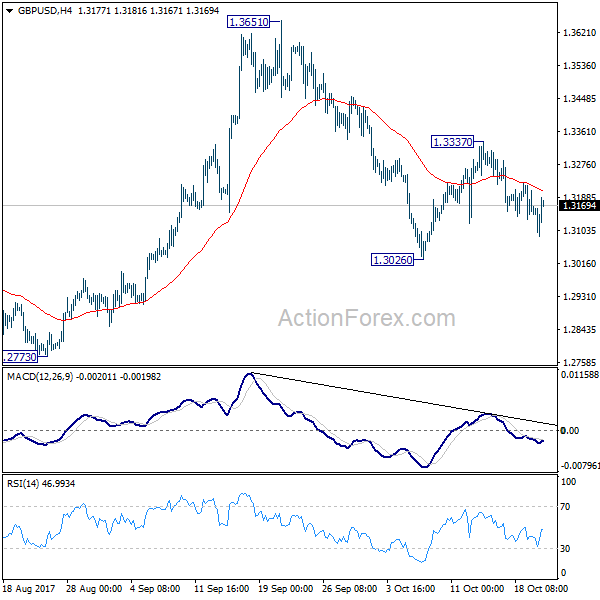
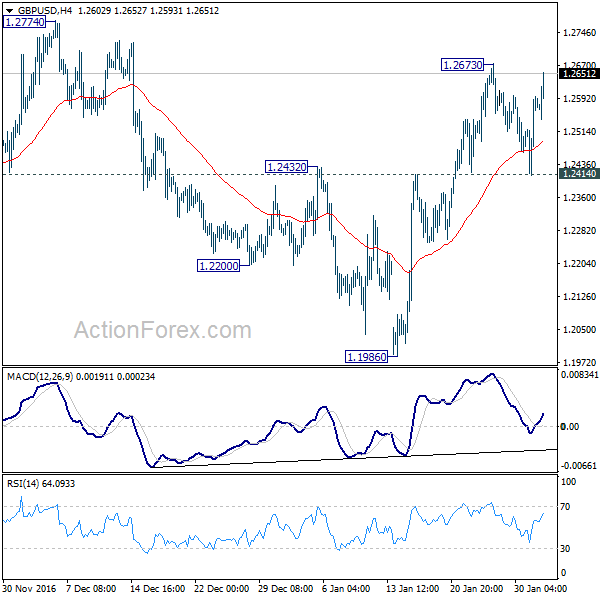
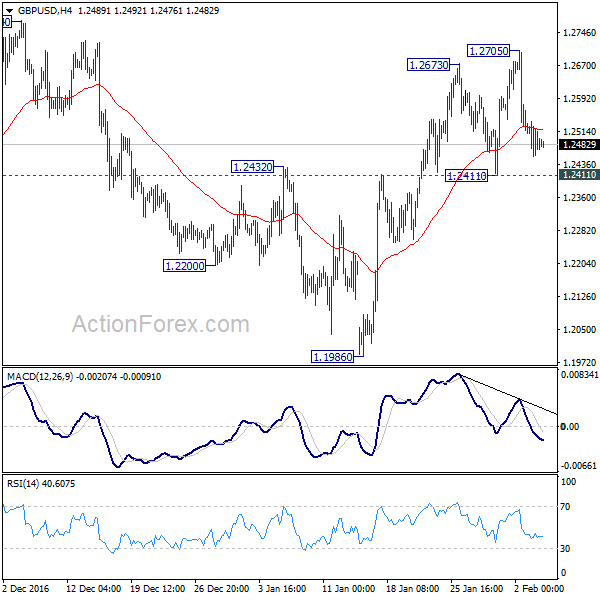
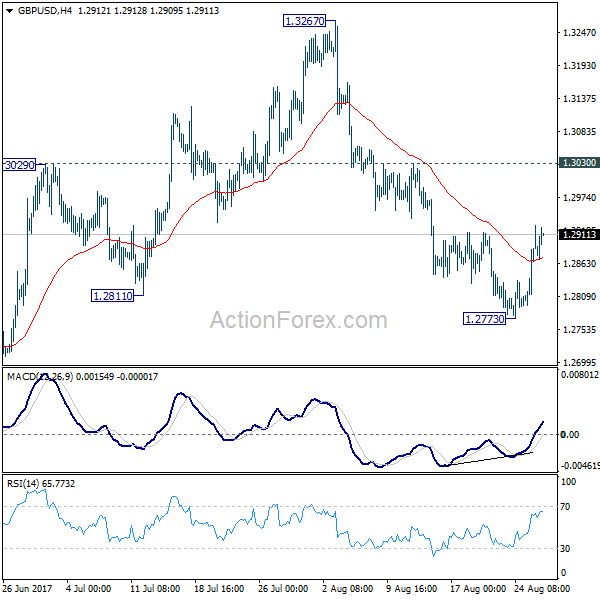
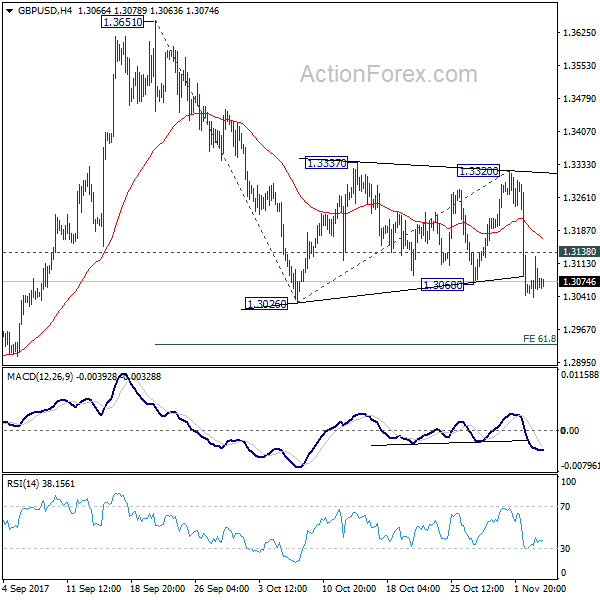
Daily Pivots: (S1) 1.2680; (P) 1.2711; (R1) 1.2748; More

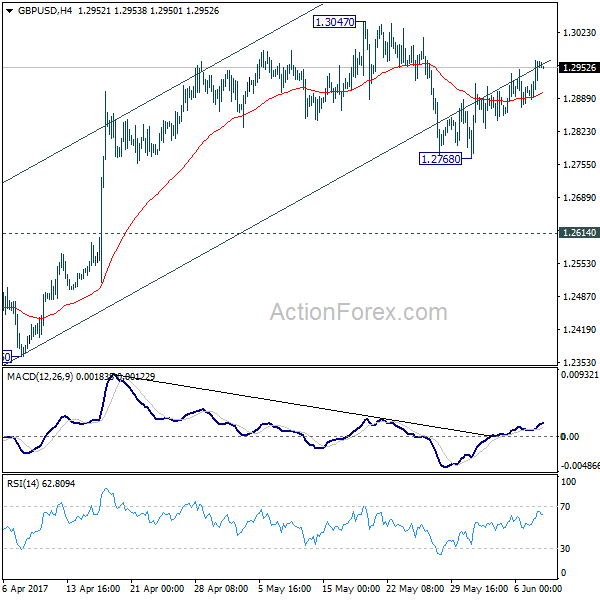
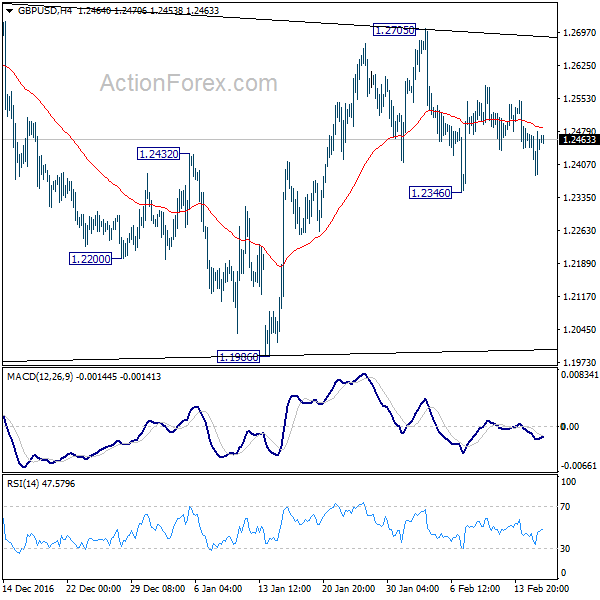
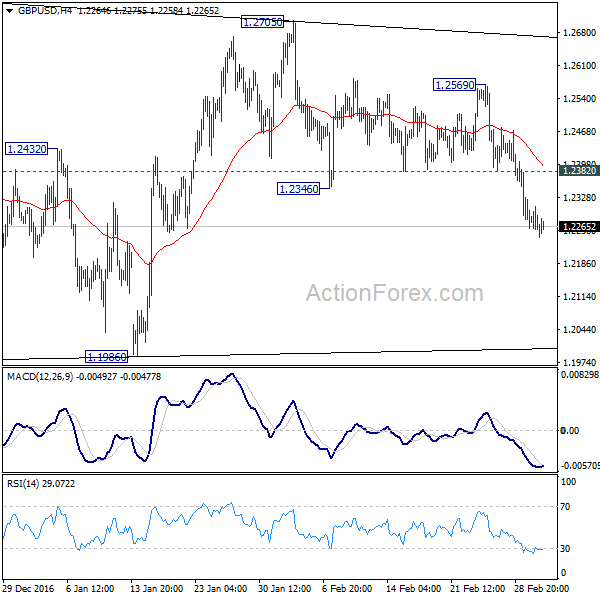
Intraday bias in GBP/USD remains neutral for the moment. With 1.2813 resistance intact, deeper decline is expected. Sustained break of 1.2614 resistance turned support will confirm our bearish view that consolidation pattern from 1.1946 has completed. In that case, deeper fall should be seen back to retest 1.1946 low. However, break of 1.2813 resistance will dampen our view and turn bias back to the upside for 1.3047 and above.

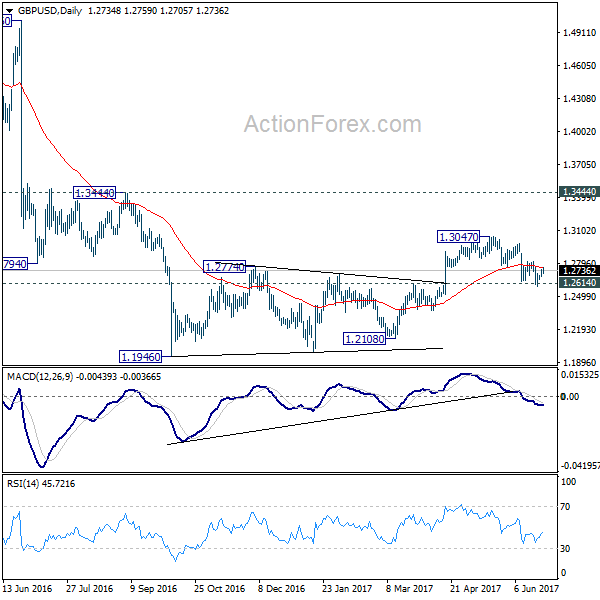
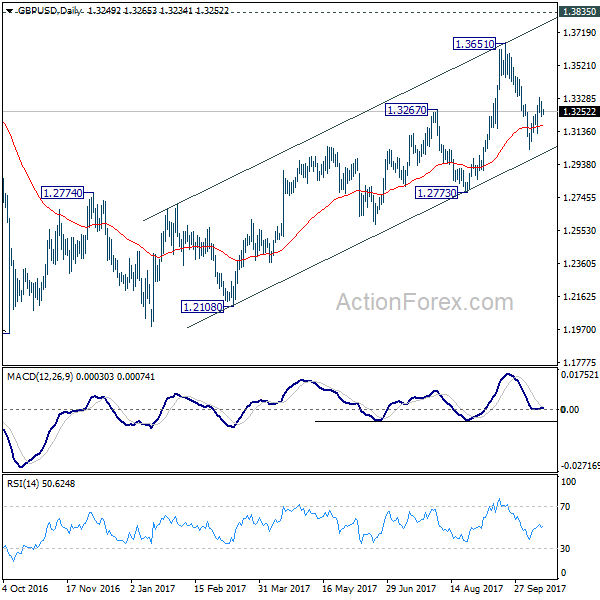
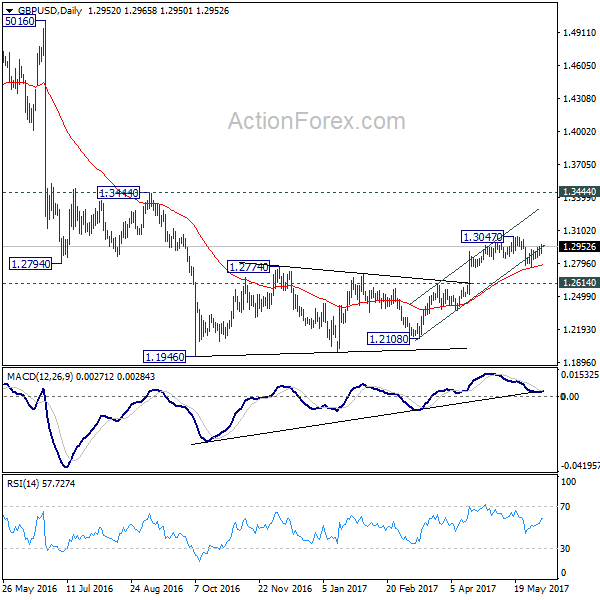
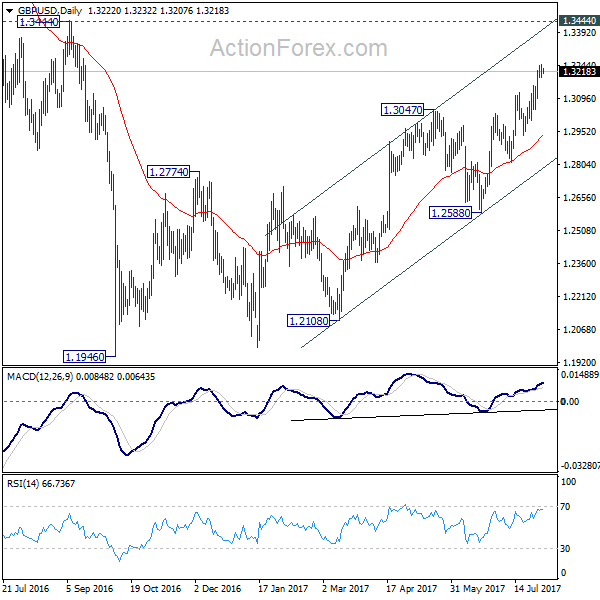
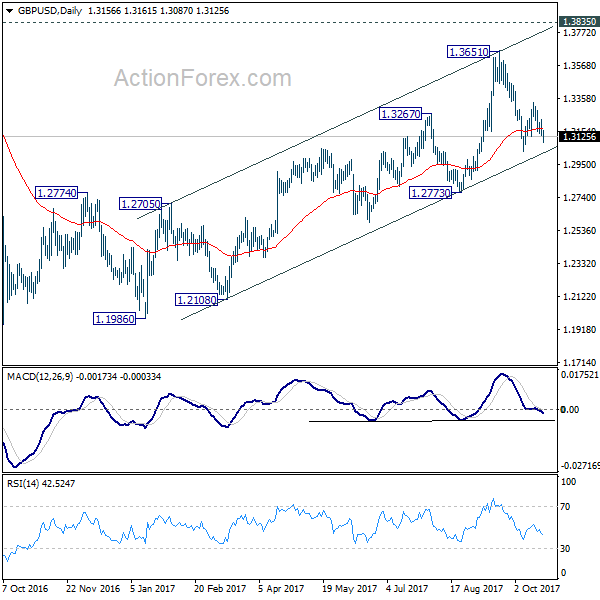
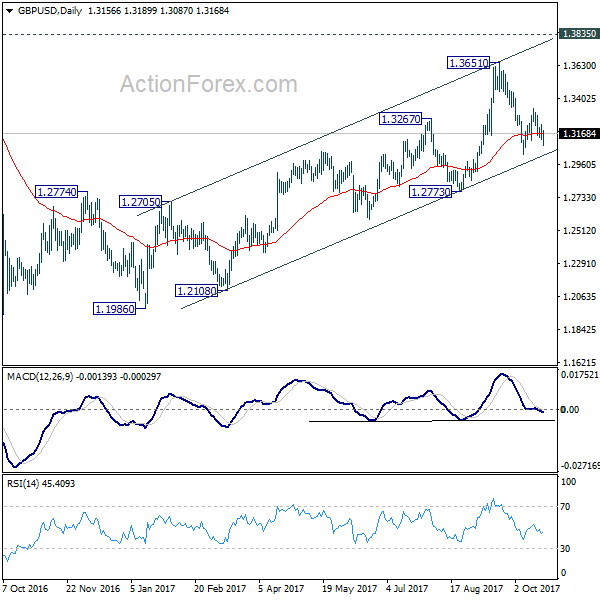
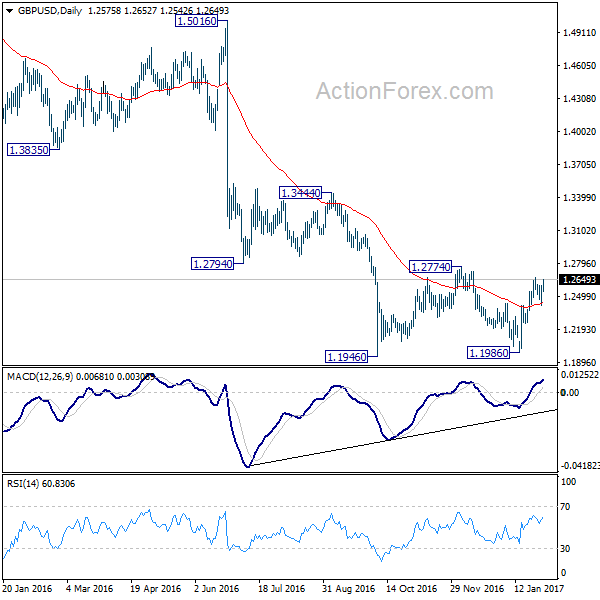
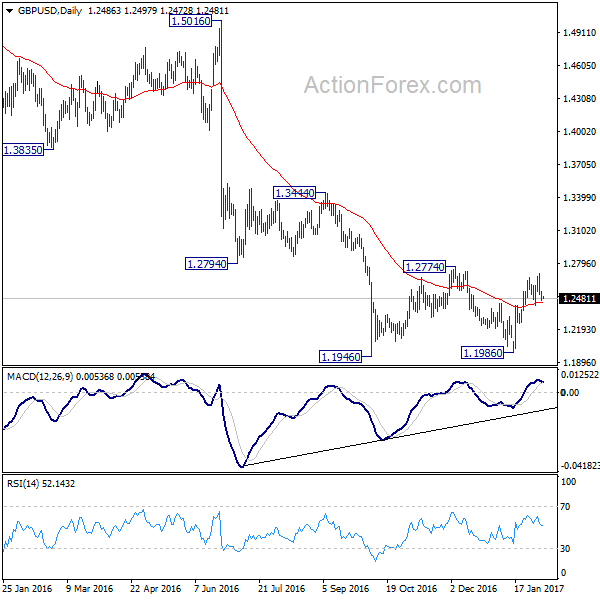
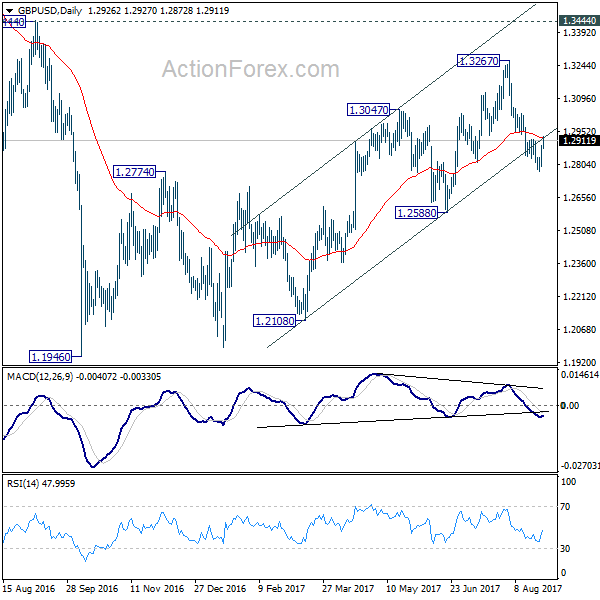
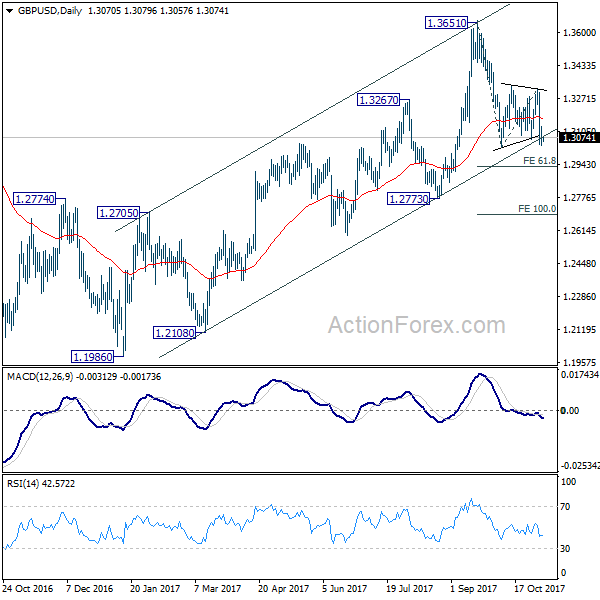
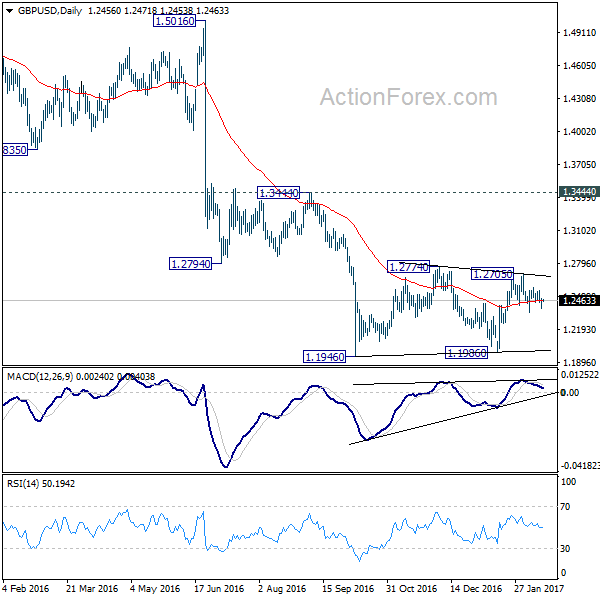
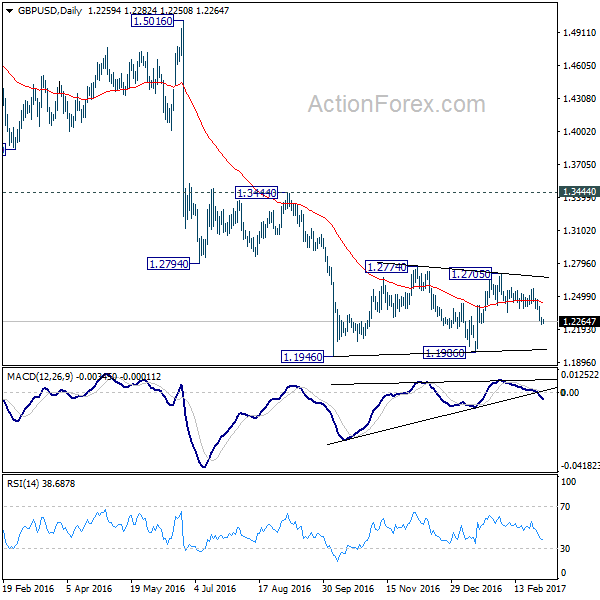
In the bigger picture, fall from 1.7190 is seen as part of the down trend from 2.1161. Price actions from 1.1946 medium term low are seen as a consolidation pattern, which could have completed at 1.3047 after hitting 55 week EMA. Break of 1.1946 low will target 61.8% projection of 1.5016 to 1.1946 from 1.3047 at 1.1150 next. In case the consolidation from 1.1946 extends, outlook will stay remain bearish as long as 1.3444 resistance holds.

GBP/USD 4 Hours Chart

GBP/USD Daily Chart

GBP/USD Mid-Day Outlook

Daily Pivots: (S1) 1.2316; (P) 1.2375; (R1) 1.2417; More

GBP/USD’s rise from 1.2108 resumed after brief consolidation. Intraday bias is back on the upside for 1.2569 resistance. Break will target 1.2705/74 resistance zone. But still, price actions from 1.1946 are seen as a consolidation pattern. Hence, we’d expect strong resistance from 1.2705/2774 to limit upside and bring down trend resumption. On the downside, break of 1.2323 support will turn bias back to the downside for 1.2108 support. Though, sustained break of 1.2774 will extend the rise towards 1.3444 key resistance level.

In the bigger picture, fall from 1.7190 is seen as part of the down trend from 2.1161. There is no sign of medium term bottoming yet. Sustained trading below 61.8% projection of 2.1161 to 1.3503 from 1.7190 at 1.2457 will target 100% projection at 0.9532. Overall, break of 1.3444 resistance is needed to confirm medium term bottoming. Otherwise, outlook will remain bearish.

GBP/USD 4 Hours Chart

GBP/USD Daily Chart

GBP/USD Daily Outlook

Daily Pivots: (S1) 1.3212; (P) 1.3261; (R1) 1.3299; More….

A temporary top is in place at 1.3337 in GBP/USD and intraday bias is turned neutral first. Another rise is mildly in favor as long as 1.3120 minor support holds. Above 1.3337 will target a test on 1.3651 high. Break there will resume medium term rise from 1.1946 and target 1.3835 key resistance next. On the downside, below 1.3120 minor support will resume the fall from 1.3651 through 1.3026 instead.

In the bigger picture, while the medium term rebound from 1.1946 was strong, GBP/USD hit strong resistance from the long term falling trend line. Outlook is turned a bit mixed and we’ll turn neutral first. On the downside, decisive break of 1.2773 key support will argue that rebound from 1.1946 has completed. The corrective structure of rise from 1.1946 to 1.3651 will in turn suggest that long term down trend is now completed. Break of 1.1946 low should then be seen. On the upside, break of 1.3835 support turned resistance will revive the case of trend reversal and target 38.2% retracement of 2.1161 (2007 high) to 1.1946 (2016 low) at 1.5466.

GBP/USD 4 Hours Chart

GBP/USD Daily Chart

GBP/USD Daily Outlook

Daily Pivots: (S1) 1.2908; (P) 1.2937; (R1) 1.2988; More

Intraday bias in GBP/USD remains neutral for the moment. On the downside, below 1.2768 minor support will extend the fall from 1.3047 to 1.2614 resistance turned support. Decisive break there should confirm completion of the consolidation pattern from 1.1946 and resume the larger down trend through this low. On the upside, break of 1.3047 will extend the correction with another rise towards 1.3444 key resistance.

In the bigger picture, fall from 1.7190 is seen as part of the down trend from 2.1161. The rejection from 55 week EMA is maintaining bearishness in the pair. Also, at this point, as long as 1.3444 resistance holds, fall from 1.7190 is still expected to continue. Break of above mentioned 1.2614 support will affirm this bearish case.

GBP/USD 4 Hours Chart

GBP/USD Daily Chart

GBP/USD Daily Outlook

Daily Pivots: (S1) 1.3191; (P) 1.3221; (R1) 1.3252; More

GBP/USD lost some momentum after hitting 1.3249. Intraday bias is turned neutral for some consolidations first. Further rally is expected as long as 1.3096 minor support holds. Above 1.3249 will target 1.3444 key resistance. But still, price actions from 1.1946 are viewed as a corrective pattern. Hence, we’ll look for topping signal again around 1.3444. Meanwhile, break of 1.3096 will be the first sign of reversal. Intraday bias will be turned back to 1.2932 support first in that case.

In the bigger picture, overall, price actions from 1.1946 medium term low are seen as a corrective pattern that is still in progress. While further upside is expected, larger outlook remains bearish as long as 1.3444 key resistance holds. Down trend from 1.7190 (2014 high) is expected to resume later after the correction completes. And break of 1.2588 will indicate that such down trend is resuming.

GBP/USD 4 Hours Chart

GBP/USD Daily Chart

GBP/USD Daily Outlook

Daily Pivots: (S1) 1.3435; (P) 1.3490; (R1) 1.3556; More…..

GBP/USD’s rally and break of 1.3549 resistance confirms resumption of rise from 1.3038. And it’s likely that medium term rally from 1.1946 is resuming too. Intraday bias stays on the upside for 1.3651 resistance next. On the downside, below 1.3492 minor support will turn intraday bias neutral and bring consolidation before staging another rise.

In the bigger picture, while the medium term rebound from 1.1946 low was strong, it’s limited below 1.3835 key support turned resistance. As long as 1.3835 holds, we’d view such rebound as a correction. That is, we’d expect another leg in the long term down trend through 1.1946 low. However, sustained break of 1.3835 should at least send GBP/USD to 38.2% retracement of 2.1161 (2007 high) to 1.1946 (2016 low) at 1.5466.

GBP/USD 4 Hours Chart

GBP/USD Daily Chart

GBP/USD Daily Outlook

Daily Pivots: (S1) 1.3109; (P) 1.3169; (R1) 1.3217; More….

Break of 1.3120 minor support suggests that recovery from 1.3026 is completed at 1.3337. Intraday bias in GBP/USD is turned back to the downside for 1.3026 first. Break will resume whole decline from 1.3651 and target 1.2773 key support next. That will also revive the case that medium term rise from 1.1946 has completed at 1.3651. Meanwhile, above 1.3337 will bring retest of 1.3651 high instead.

In the bigger picture, while the medium term rebound from 1.1946 was strong, GBP/USD hit strong resistance from the long term falling trend line. Outlook is turned a bit mixed and we’ll turn neutral first. On the downside, decisive break of 1.2773 key support will argue that rebound from 1.1946 has completed. The corrective structure of rise from 1.1946 to 1.3651 will in turn suggest that long term down trend is now completed. Break of 1.1946 low should then be seen. On the upside, break of 1.3835 support turned resistance will revive the case of trend reversal and target 38.2% retracement of 2.1161 (2007 high) to 1.1946 (2016 low) at 1.5466.

GBP/USD 4 Hours Chart

GBP/USD Daily Chart

GBP/USD Mid-Day Outlook

Daily Pivots: (S1) 1.3109; (P) 1.3169; (R1) 1.3217; More….

GBP/USD recovers again after hitting 1.3087 and intraday bias remains neutral again. On the downside, break of 1.3026 will resume whole decline from 1.3651 and target 1.2773 key support next. That will also revive the case that medium term rise from 1.1946 has completed at 1.3651. Meanwhile, above 1.3337 will bring retest of 1.3651 high instead.

In the bigger picture, while the medium term rebound from 1.1946 was strong, GBP/USD hit strong resistance from the long term falling trend line. Outlook is turned a bit mixed and we’ll turn neutral first. On the downside, decisive break of 1.2773 key support will argue that rebound from 1.1946 has completed. The corrective structure of rise from 1.1946 to 1.3651 will in turn suggest that long term down trend is now completed. Break of 1.1946 low should then be seen. On the upside, break of 1.3835 support turned resistance will revive the case of trend reversal and target 38.2% retracement of 2.1161 (2007 high) to 1.1946 (2016 low) at 1.5466.

GBP/USD 4 Hours Chart

GBP/USD Daily Chart

GBP/USD Mid-Day Outlook

Daily Pivots: (S1) 1.2460; (P) 1.2528; (R1) 1.2644; More

GBP/USD rebounds further today but stays below 1.2673 so far. Intraday bias remains neutral. Overall, rise from 1.1986 is seen as the third leg of the consolidation pattern from 1.1946. Above 1.2673 will turn bias to the upside and extend such rise towards 1.2774 resistance. We’d expect strong resistance from there to limit upside and bring down trend resumption eventually. On the downside, firm break of 1.2414 minor support will argue that it’s completed and turn bias to the downside for 1.1946 low.

In the bigger picture, fall from 1.7190 is seen as part of the down trend from 2.1161. There is no sign of medium term bottoming yet. Sustained trading below 61.8% projection of 2.1161 to 1.3503 from 1.7190 at 1.2457 will target 100% projection at 0.9532. Overall, break of 1.3444 resistance is needed to confirm medium term bottoming. Otherwise, outlook will remain bearish.

GBP/USD 4 Hours Chart

GBP/USD Daily Chart

Subscribe to our daily and mid-day newsletter to get this report delivered to your mail box

GBP/USD Mid-Day Outlook

Daily Pivots: (S1) 1.2970; (P) 1.2998; (R1) 1.3030; More

A temporary low is in place at 1.2950 with 4 hour MACD crossed above signal line and intraday bias is turned neutral first. Deeper decline will be expected as long as 1.3111 resistance holds. As noted before, price actions from 1.1946 are seen as a corrective pattern and could have completed at 1.3267. Break of 1.2932 will affirm this bearish case and target 1.2588 key near term support for confirmation. However, break of 1.3111 resistance will turn bias back to the upside for retesting 1.3267 high.

In the bigger picture, overall, price actions from 1.1946 medium term low are seen as a corrective pattern that is still in progress. While further upside is expected, larger outlook remains bearish as long as 1.3444 key resistance holds. Down trend from 1.7190 (2014 high) is expected to resume later after the correction completes. And break of 1.2588 will indicate that such down trend is resuming.

GBP/USD 4 Hours Chart

GBP/USD Daily Chart

GBP/USD Daily Outlook

Daily Pivots: (S1) 1.2445; (P) 1.2491; (R1) 1.2526; More

GBP/USD is staying in range below 1.2705 and intraday bias remains neutral for the moment. As noted before, rise from 1.1986 is seen as the third leg of the consolidation pattern from 1.1946. Hence, in case of another rise, we’d expect upside to be limited by 1.2774 resistance and bring down trend resumption. On the downside, below 1.2411 minor support will argue that rise from 1.1986 is completed and turn bias to the downside for 1.1946 low.

In the bigger picture, fall from 1.7190 is seen as part of the down trend from 2.1161. There is no sign of medium term bottoming yet. Sustained trading below 61.8% projection of 2.1161 to 1.3503 from 1.7190 at 1.2457 will target 100% projection at 0.9532. Overall, break of 1.3444 resistance is needed to confirm medium term bottoming. Otherwise, outlook will remain bearish.

GBP/USD 4 Hours Chart

GBP/USD Daily Chart

Subscribe to our daily and mid-day newsletter to get this report delivered to your mail box

GBP/USD Mid-Day Outlook

Daily Pivots: (S1) 1.3076; (P) 1.3125; (R1) 1.3165; More….

GBP/USD struggles to take out 4 hour 55 EMA and weakens mildly. But it’s staying in range of 1.3038/3337. Intraday bias remains neutral and consolidative trading would continue. In case of stronger rise, upside should be limited below 1.3337 resistance to bring fall resumption. Break of 1.3038 will now resume decline from 1.3651 to 1.2773 key support level. However, decisive break of 1.3337 will indicate that pull back from 1.3651 is completed and medium term rise from 1.1946 is resuming.

In the bigger picture, as noted before, GBP/USD hit strong resistance from the long term falling trend line. Current development is starting to favor that corrective rebound from 1.1946 low has completed at 1.3651. Decisive break of 1.2773 will confirm this bearish case and target a test on 1.1946 low next, with prospect of resuming the low term down trend. Nonetheless, break of 1.3320 resistance will restore the rise from 1.1946 for 38.2% retracement of 2.1161 (2007 high) to 1.1946 (2016 low) at 1.5466.

GBP/USD 4 Hours Chart

GBP/USD Daily Chart

GBP/USD Mid-Day Outlook

Daily Pivots: (S1) 1.2816; (P) 1.2852; (R1) 1.2911; More

GBP/USD’s recovery from 1.2773 continues today but it’s staying well below 1.3030 resistance so far. Intraday bias remains neutral with mildly bearish near term outlook. We’re favoring the case that correction from 1.1946 is completed at 1.3267. Below 1.2773 will target 1.2588 key near term support first. Decisive break of 1.2588 will confirm our view and target a test on 1.1946 low. Though, break of 1.3030 will dampen this bearish view and turn bias back to the upside for retesting 1.3267.

In the bigger picture, overall, price actions from 1.1946 medium term low are seen as a corrective pattern. While further rise cannot be ruled out, larger outlook remains bearish as long as 1.3444 key resistance holds. Down trend from 1.7190 (2014 high) is expected to resume later after the correction completes. And break of 1.2588 will indicate that such down trend is resuming.

GBP/USD 4 Hours Chart

GBP/USD Daily Chart

GBP/USD Mid-Day Outlook

Daily Pivots: (S1) 1.1990; (P) 1.2037; (R1) 1.2089; More

Intraday bias in GBP/USD remains on the upside as rebound from 1.1986 continues. Such rise is seen as the third leg of the consolidation pattern from 1.1946. Thus, we’d expect strong resistance at 1.2774 to limit upside and bring down trend resumption eventually. On the downside, below 1.2188 minor support will turn bias to the downside for retesting 1.1946 low.

In the bigger picture, fall from 1.7190 is seen as part of the down trend from 2.1161. There is no sign of medium term bottoming yet. Sustained trading below 61.8% projection of 2.1161 to 1.3503 from 1.7190 at 1.2457 will target 100% projection at 0.9532. Overall, break of 1.3444 resistance is needed to confirm medium term bottoming. Otherwise, outlook will remain bearish.

GBP/USD 4 Hours Chart

GBP/USD Daily Chart

Subscribe to our daily and mid-day newsletter to get this report delivered to your mail box

GBP/USD Daily Outlook

Daily Pivots: (S1) 1.3032; (P) 1.3079; (R1) 1.3118; More….

With 1.3138 minor resistance intact, intraday bias in GBP/USD remains mildly on the downside. Break of 1.3026 support will confirm resumption of decline from 1.3651. Next target will be 61.8% projection of 1.3651 to 1.3026 from 1.3320 at 1.2934 first. Break will bring deeper decline to 1.2773 key support level. On the upside, above 1.3138 minor resistance will extend the consolidation from 1.3026 with another rise.

In the bigger picture, as noted before, GBP/USD hit strong resistance from the long term falling trend line. Current development is starting to favor that corrective rebound from 1.1946 low has completed at 1.3651. Decisive break of 1.2773 will confirm this bearish case and target a test on 1.1946 low next, with prospect of resuming the low term down trend. Nonetheless, break of 1.3320 resistance will restore the rise from 1.1946 for 38.2% retracement of 2.1161 (2007 high) to 1.1946 (2016 low) at 1.5466.

GBP/USD 4 Hours Chart

GBP/USD Daily Chart

GBP/USD Daily Outlook

Daily Pivots: (S1) 1.3423; (P) 1.3486; (R1) 1.3529; More….

Intraday bias is GBP/USD remains neutral for consolidation below 1.3549 temporary top. Downside of retreat should be contained by 1.3337 resistance turned support to bring another rise. Above 1.3549 will target 1.3651 and above. However, decisive break of 1.3337 will argue that rise from 1.3038 has completed and turn bias back to the downside for this support.

In the bigger picture, while the medium term rebound from 1.1946 low is strong, it’s still limited below 1.3835 key support turned resistance. As long as 1.3835 holds, we’d view such rebound as a correction. That is, we’d expect another leg in the long term down trend through 1.1946 low. However, sustained break of 1.3835 should at least send GBP/USD to 38.2% retracement of 2.1161 (2007 high) to 1.1946 (2016 low) at 1.5466.

GBP/USD 4 Hours Chart

GBP/USD Daily Chart

GBP/USD Daily Outlook

Daily Pivots: (S1) 1.2401; (P) 1.2440; (R1) 1.2499; More

GBP/USD is still bounded in range of 1.2346/2705 and intraday bias remains neutral at this point. Price actions from 1.1946 are viewed as a consolidation pattern, with rise from 1.1986 as the third leg. In case of another rise, we’d expect upside to be limited by 1.2774 to bring larger down trend resumption. On the downside, below 1.2346 will revive the case that such consolidation is completed at 1.2705 already. In that case, intraday bias will turn back to the downside for retesting 1.1946 low.

In the bigger picture, fall from 1.7190 is seen as part of the down trend from 2.1161. There is no sign of medium term bottoming yet. Sustained trading below 61.8% projection of 2.1161 to 1.3503 from 1.7190 at 1.2457 will target 100% projection at 0.9532. Overall, break of 1.3444 resistance is needed to confirm medium term bottoming. Otherwise, outlook will remain bearish.

GBP/USD 4 Hours Chart

GBP/USD Daily Chart

Subscribe to our daily and mid-day newsletter to get this report delivered to your mail box

GBP/USD Daily Outlook

Daily Pivots: (S1) 1.2235; (P) 1.2271; (R1) 1.2301; More

Intraday bias in GBP/USD remains on the downside for 1.1946/86 support zone. The consolidation pattern from 1.1946 has possibly completed at 1.2705. Break of 1.1946 will confirm our bearish view and resume the larger down trend. Nonetheless, on the upside, above 1.2382 minor resistance will delay the bearish case and turn bias neutral first.

In the bigger picture, fall from 1.7190 is seen as part of the down trend from 2.1161. There is no sign of medium term bottoming yet. Sustained trading below 61.8% projection of 2.1161 to 1.3503 from 1.7190 at 1.2457 will target 100% projection at 0.9532. Overall, break of 1.3444 resistance is needed to confirm medium term bottoming. Otherwise, outlook will remain bearish.

GBP/USD 4 Hours Chart

GBP/USD Daily Chart

GBP/USD Mid-Day Outlook

Daily Pivots: (S1) 1.3845; (P) 1.3921; (R1) 1.3984; More….

GBP/USD drops sharply today but it’s still bounded in range of 1.3764/4144. Intraday bias remains neutral first. On the downside, break of 1.3764 will extend the correction from 1.4345 to 1.3651 resistance turned support. On the upside, break of 1.4144 will extend the rise from 1.3764 and target a test on 1.4345 resistance. Break there will resume larger up trend.

In the bigger picture, as long as 1.3038 support holds, medium term outlook in GBP/USD will remains bullish. Rise from 1.1946 is at least correcting the long term down from 2007 high at 2.1161. Further rally would be seen back to 38.2% retracement of 2.1161 (2007 high) to 1.1946 (2016 low) at 1.5466. However, GBP/USD fails to sustain above 55 month EMA (now at 1.4279) so far. Break of 1.3038 support, will suggests that rise from 1.1946 has completed and will turn outlook bearish for retesting this low.

GBP/USD 4 Hours Chart

GBP/USD Daily Chart

GBP/USD Daily Outlook

Daily Pivots: (S1) 1.3814; (P) 1.3940; (R1) 1.4035; More…..

Intraday bias in GBP/USD remains on the downside as the decline from 1.4345 is still in progress for 1.3651 resistance turned support. At this point, it’s still unsure whether decline from 1.4345 is correcting rise from 1.3038, or that from 1.1946, or it’s reversing the trend. Break of 1.3651 will turn focus to key fibonacci level at 1.3429. For the moment, further decline will remain expected as long as 1.4066 minor resistance holds.

In the bigger picture, as long as 1.3038 support holds, medium term outlook in GBP/USD will remains bullish. Rise from 1.1946 is at least correcting the long term down from 2007 high at 2.1161. Further rally would be seen back to 38.2% retracement of 2.1161 (2007 high) to 1.1946 (2016 low) at 1.5466. However, GBP/USD fails to sustain above 55 month EMA (now at 1.4279 so far. Break of 1.3038 support, will suggests that rise from 1.1946 has completed and will turn outlook bearish for retesting this low.

GBP/USD 4 Hours Chart

GBP/USD Daily Chart