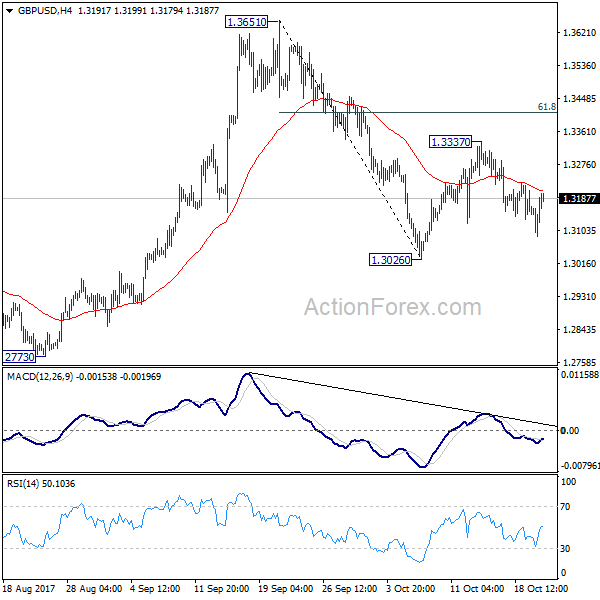
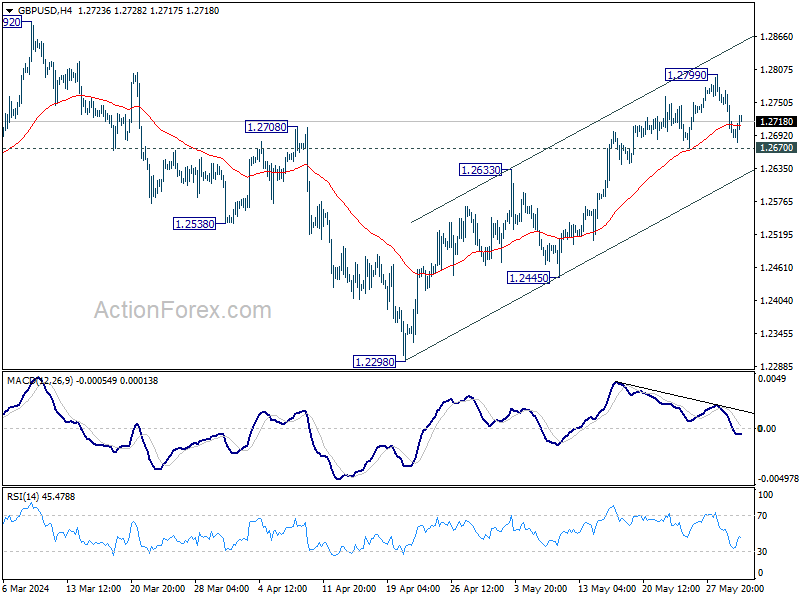
Daily Pivots: (S1) 1.2854; (P) 1.2879; (R1) 1.2913; More…
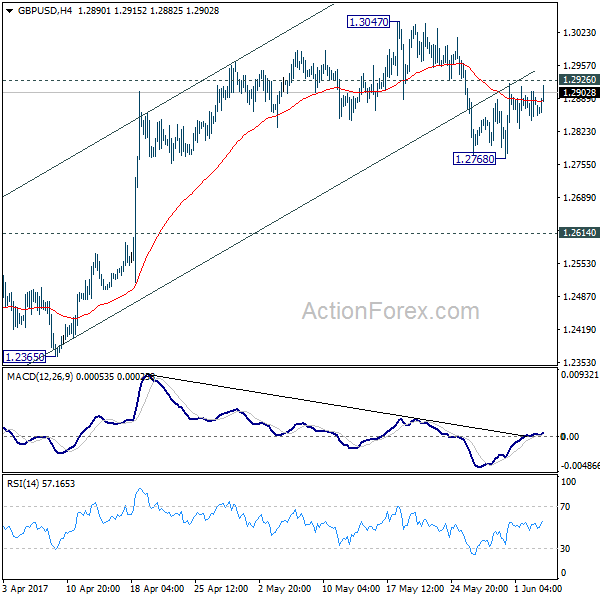
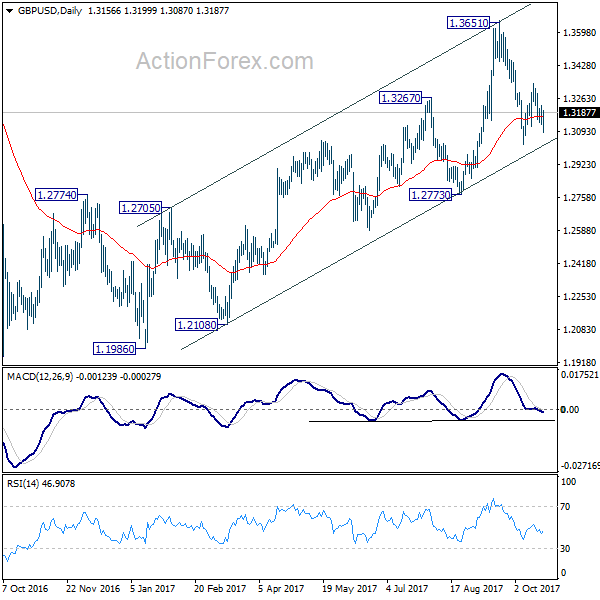
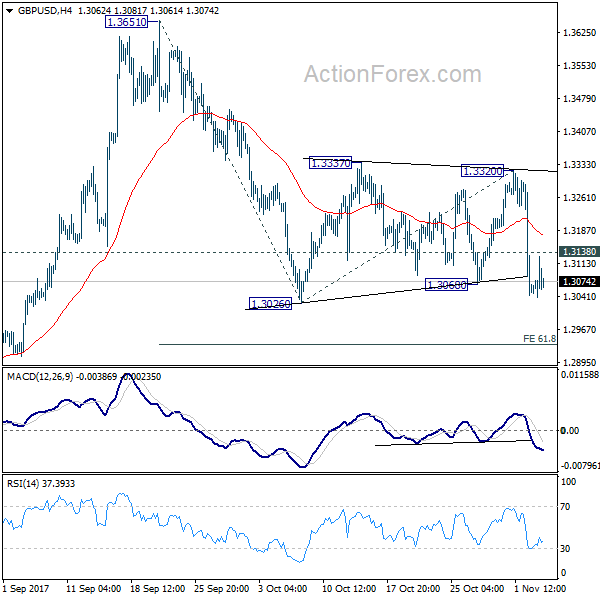
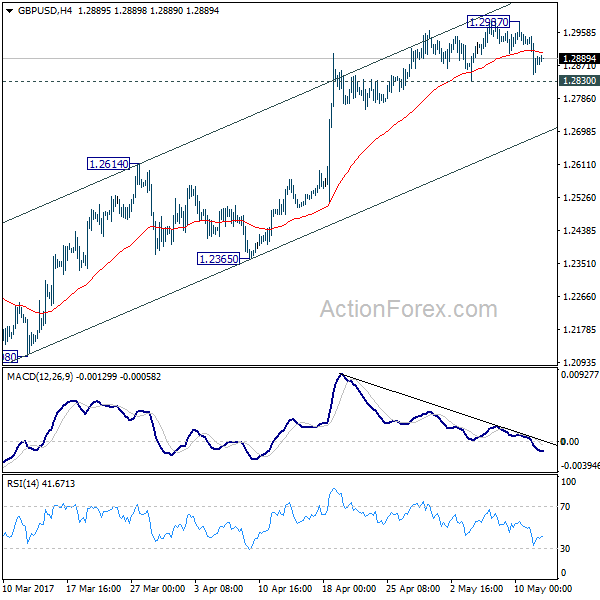
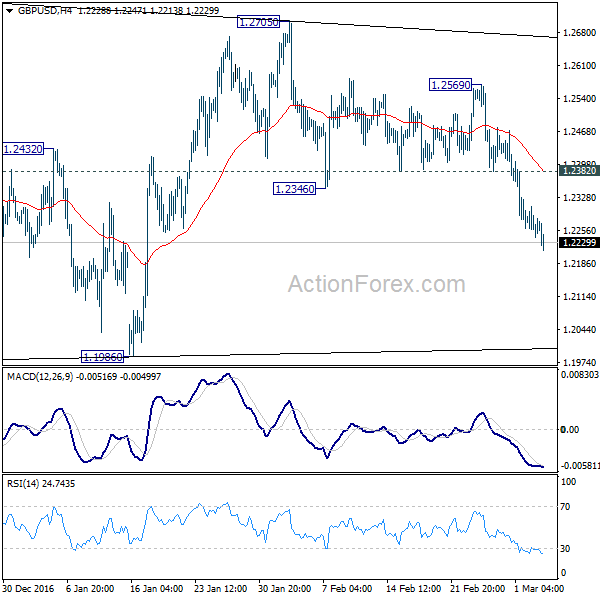
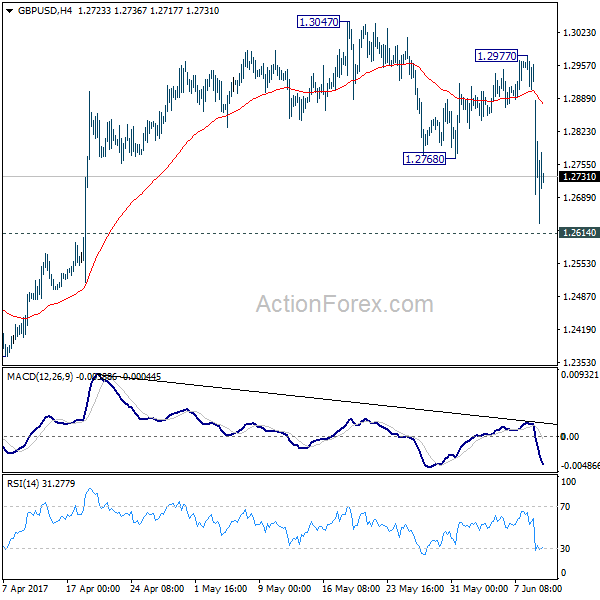
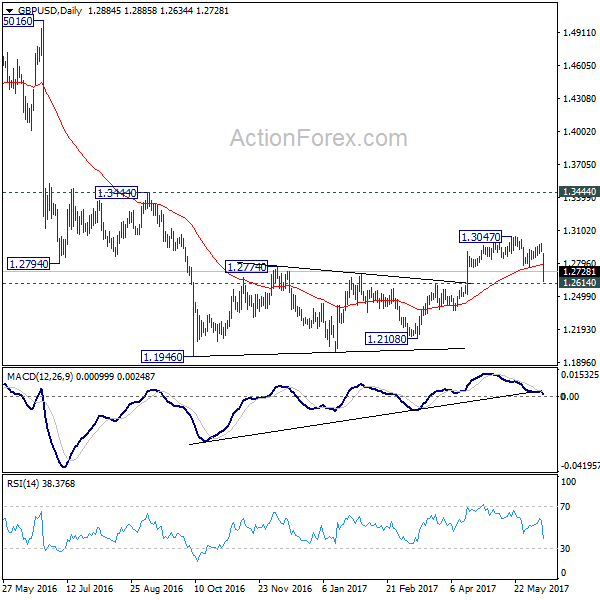
GBP/USD recovers again today but at this point it’s staying below 1.2926 minor resistance. Intraday bias remains neutral and deeper fall is still in favor. Break of 1.2768 will turn bias to the downside for 1.2614 resistance turned support first. Break there should also indicate completion of whole consolidation pattern from 1.1946 and target a retest on this low. However, break of 1.2926 will turn focus back to 1.3047 instead.
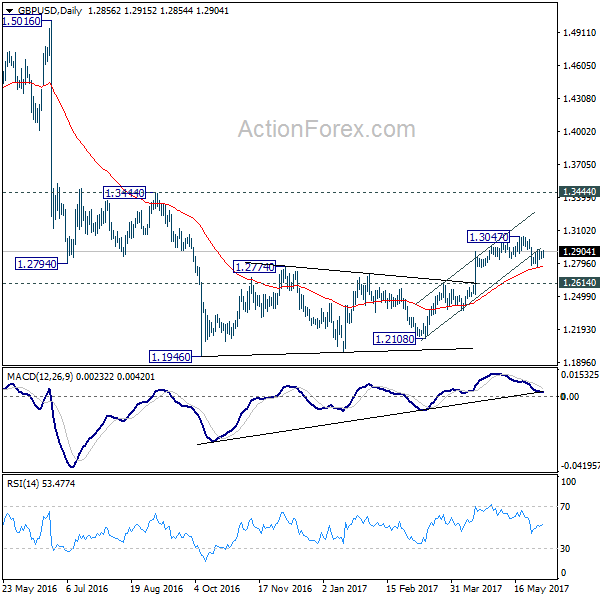
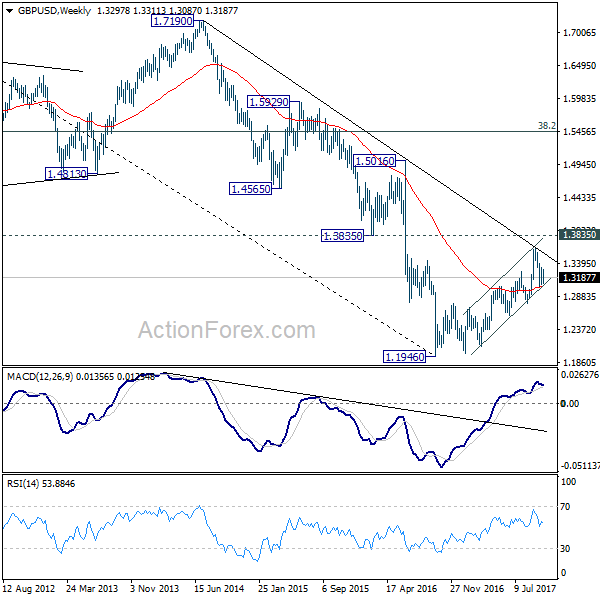
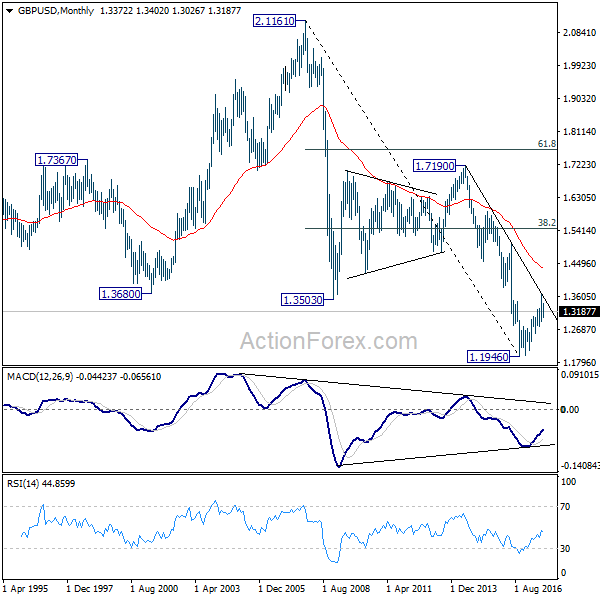
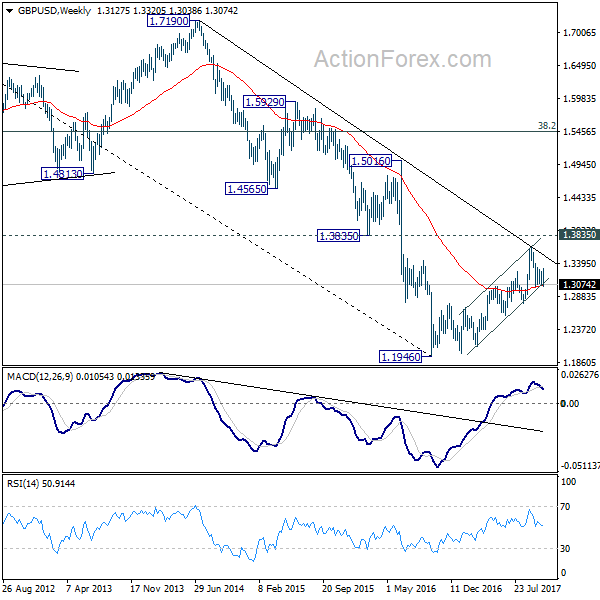
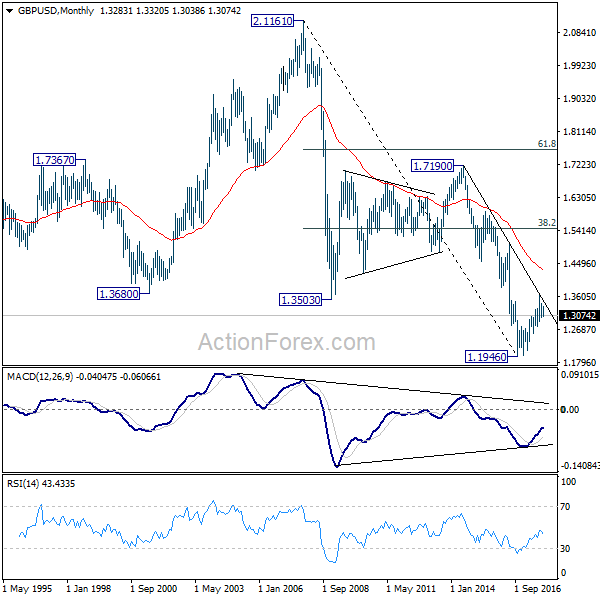
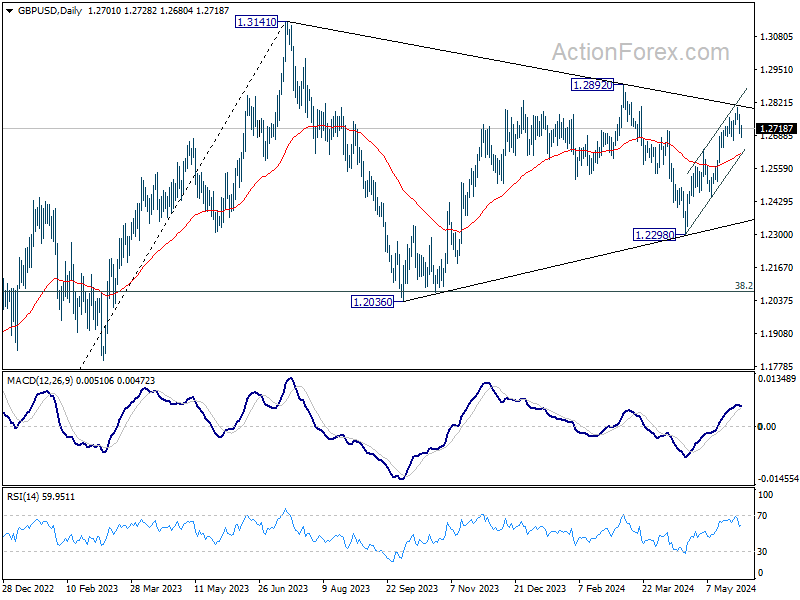
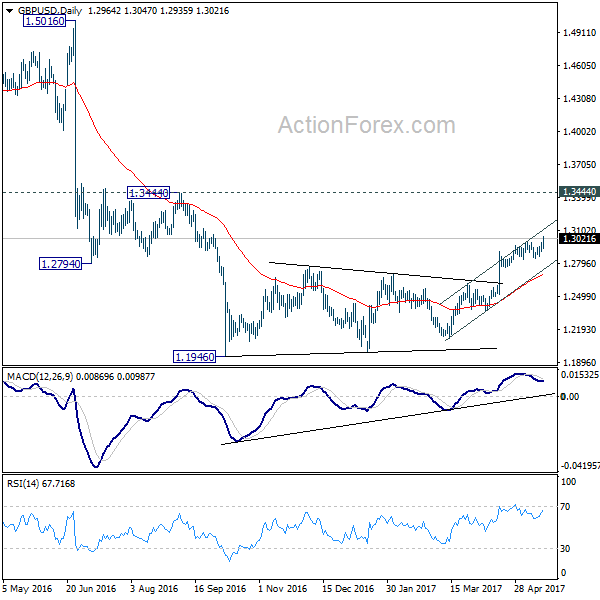
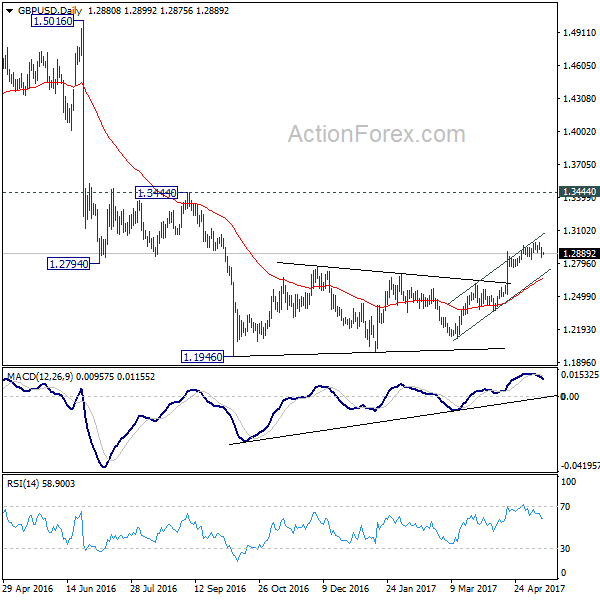
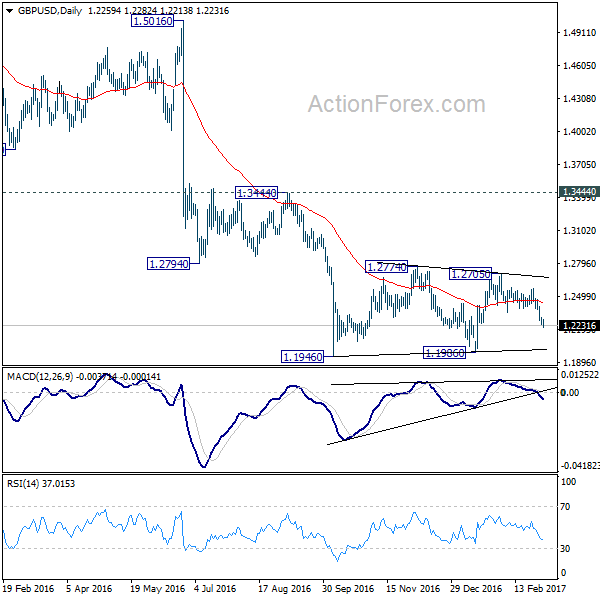
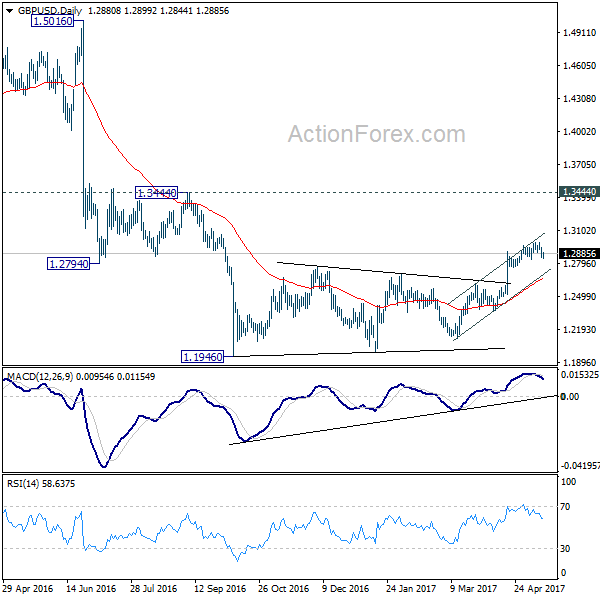
In the bigger picture, fall from 1.7190 is seen as part of the down trend from 2.1161. The rejection from 55 week EMA is maintaining bearishness in the pair. Also, at this point, as long as 1.3444 resistance holds, fall from 1.7190 is still expected to continue. Break of above mentioned 1.2614 support will affirm this bearish case.