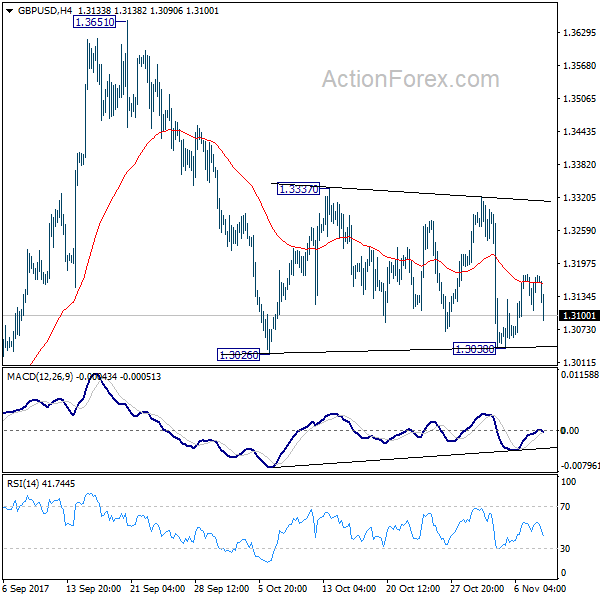
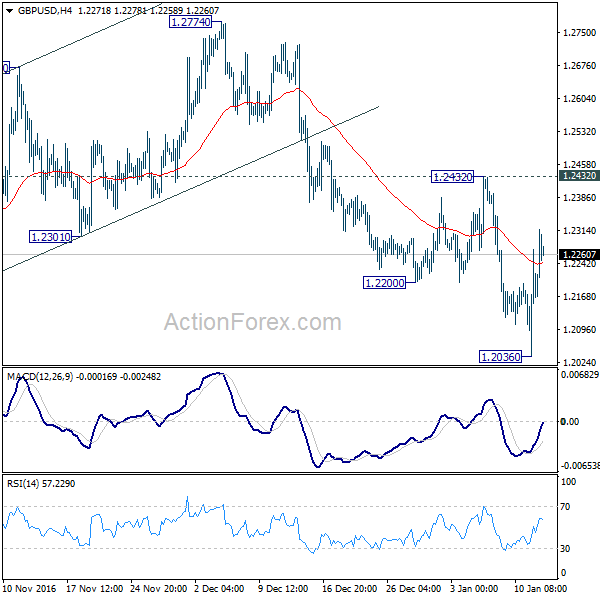
Daily Pivots: (S1) 1.3124; (P) 1.3150; (R1) 1.3193; More….
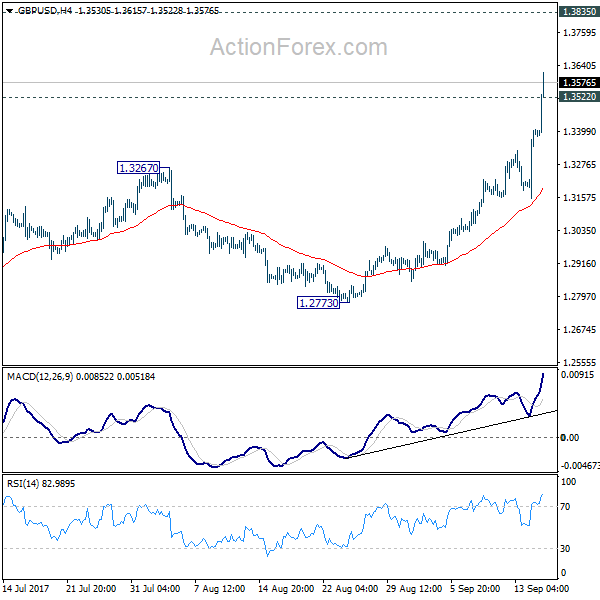
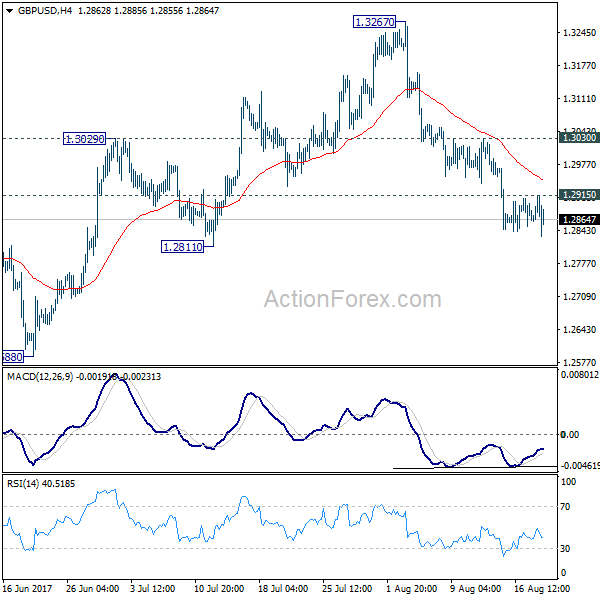
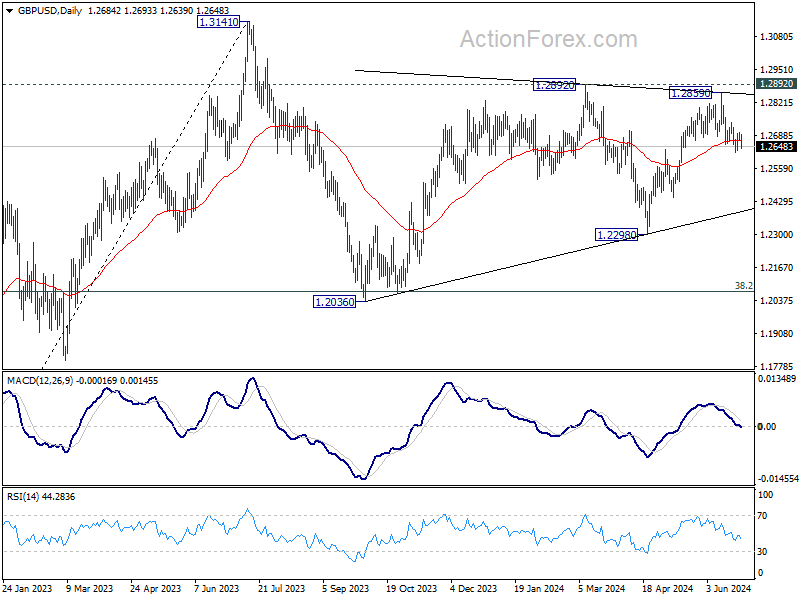
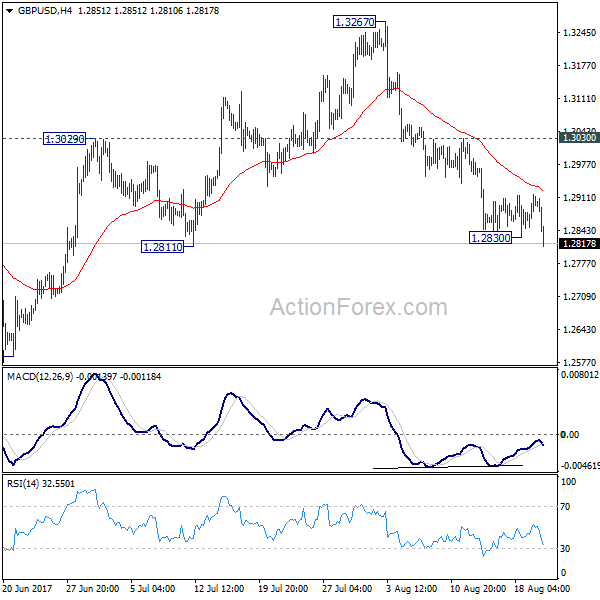
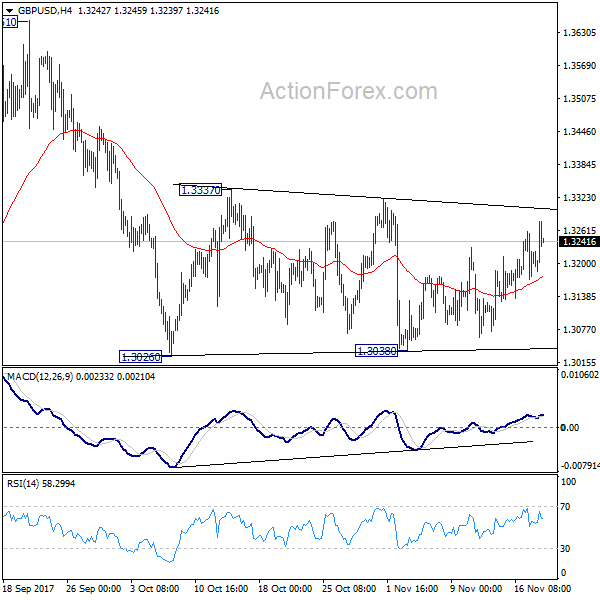
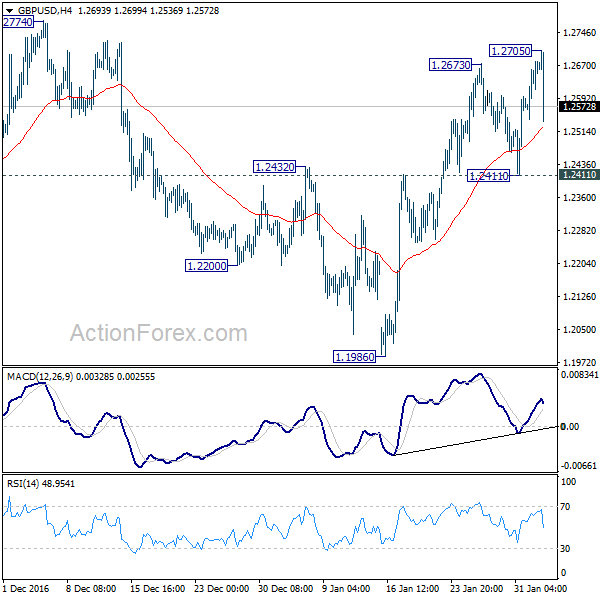
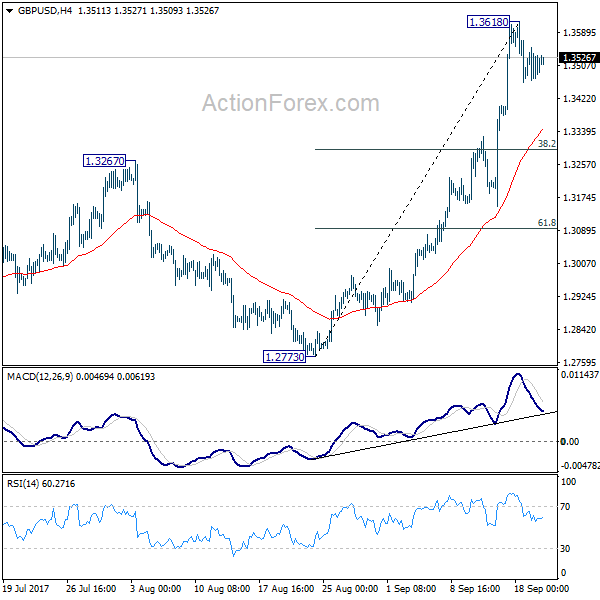
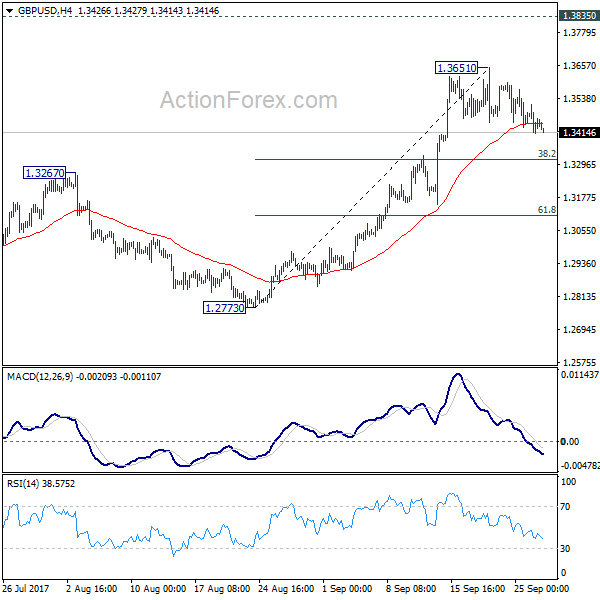
Intraday bias in GBP/USD remains neutral at this point. Consolidation from 1.3026 is still in progress. In case of stronger rise, upside should be limited below 1.3337 resistance to bring fall resumption. Break of 1.3038 will now resume decline from 1.3651 to 1.2773 key support level. However, decisive break of 1.3337 will indicate that pull back from 1.3651 is completed and medium term rise from 1.1946 is resuming.
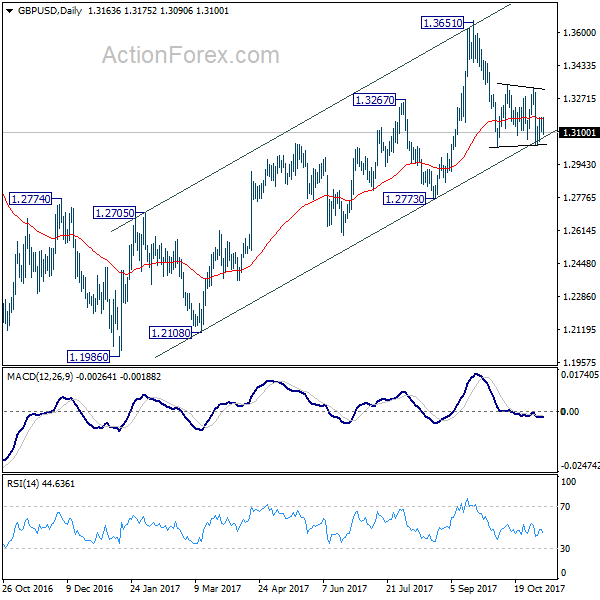
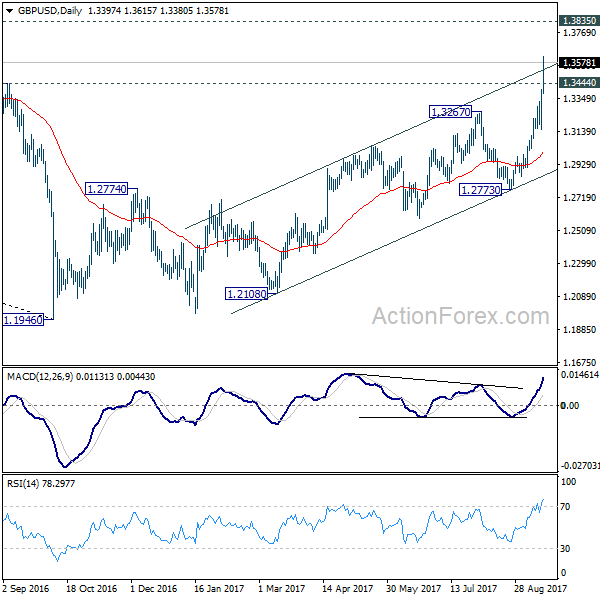
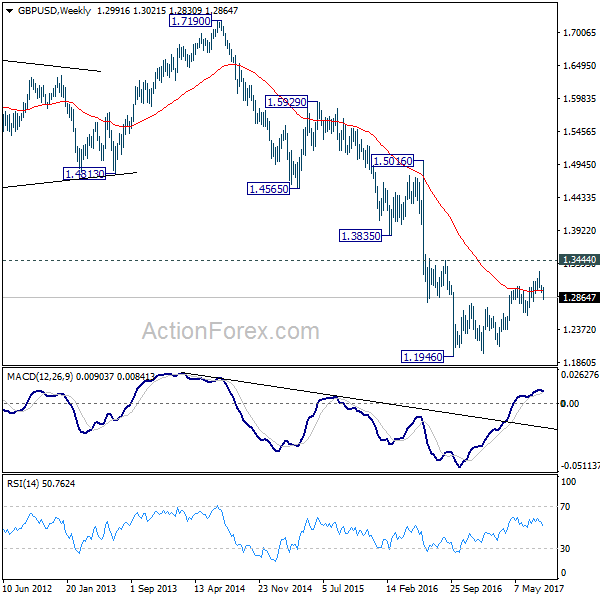
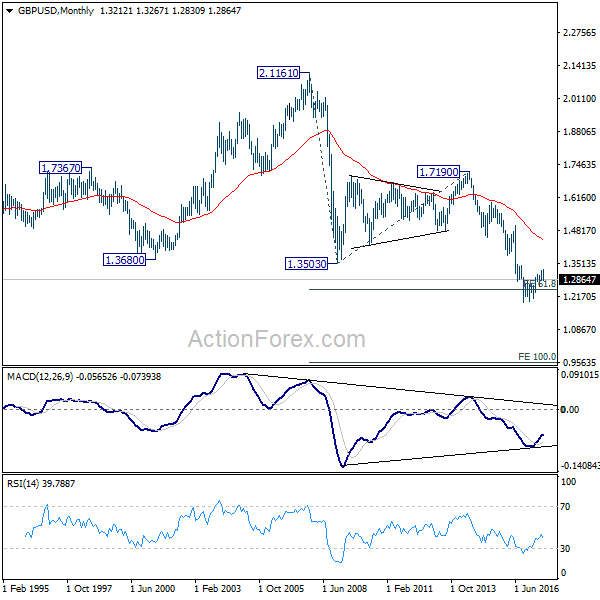
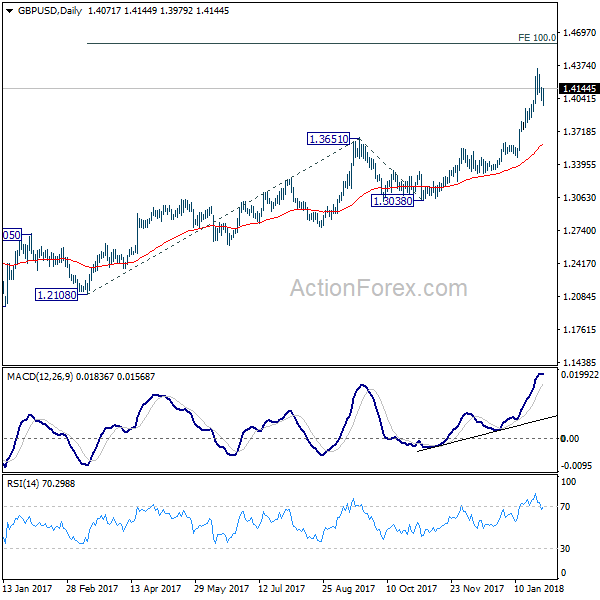
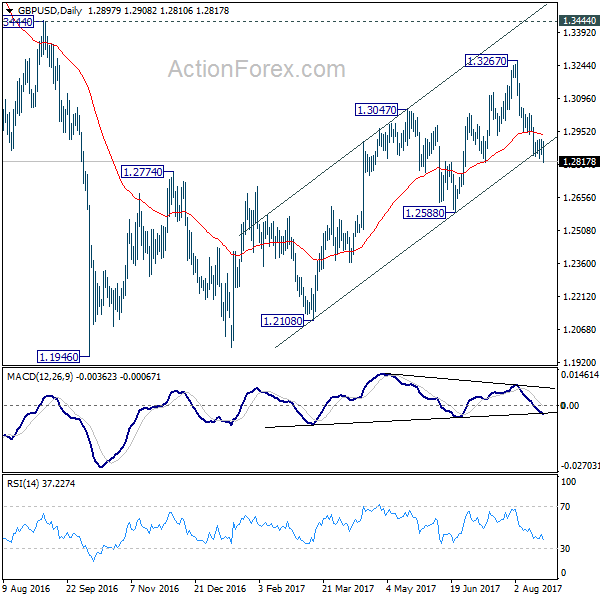
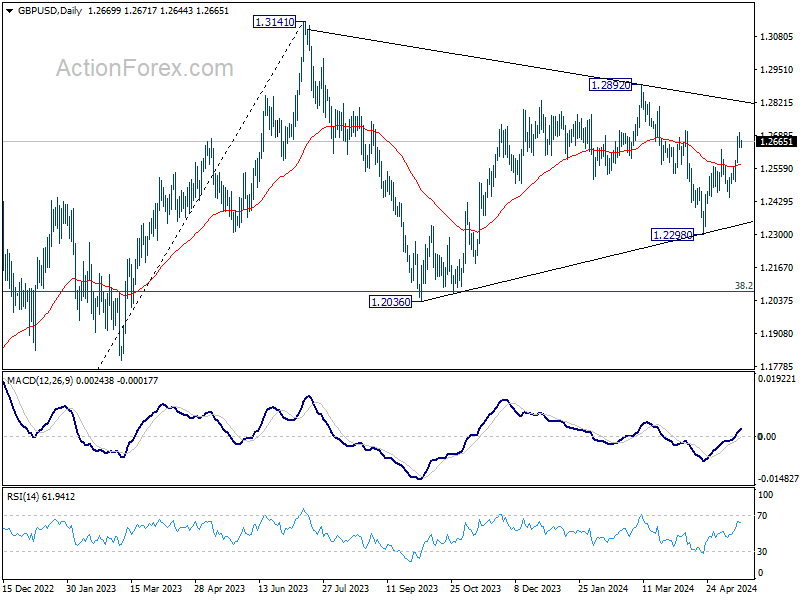
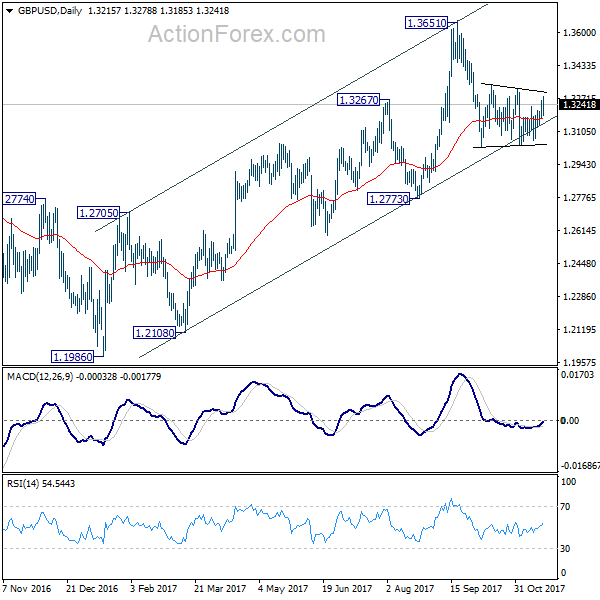
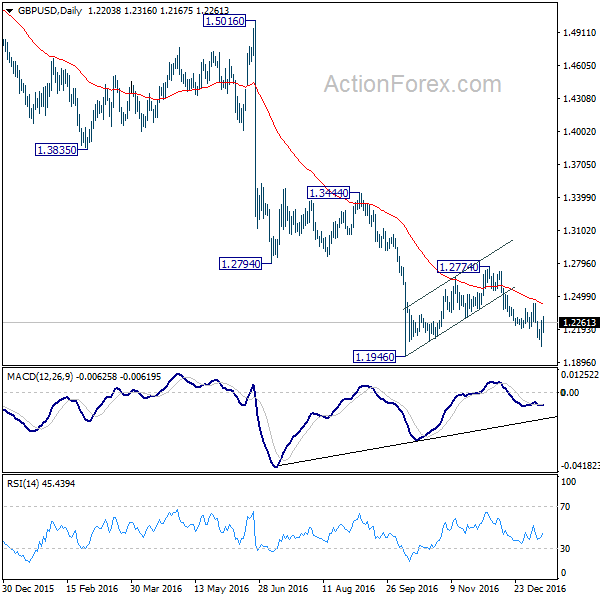
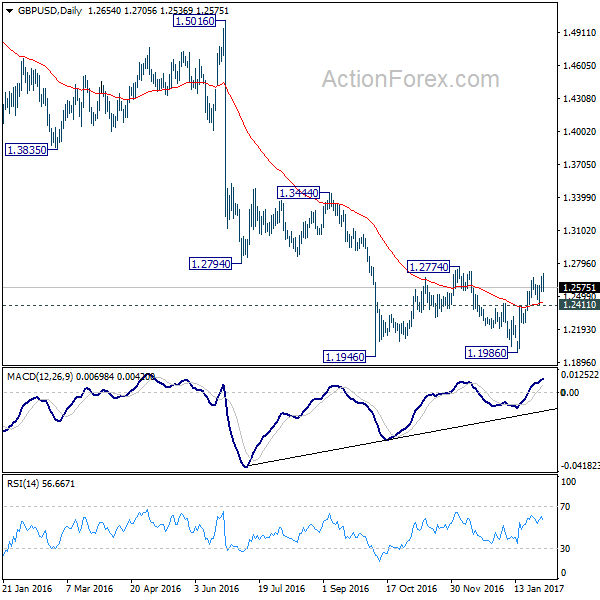
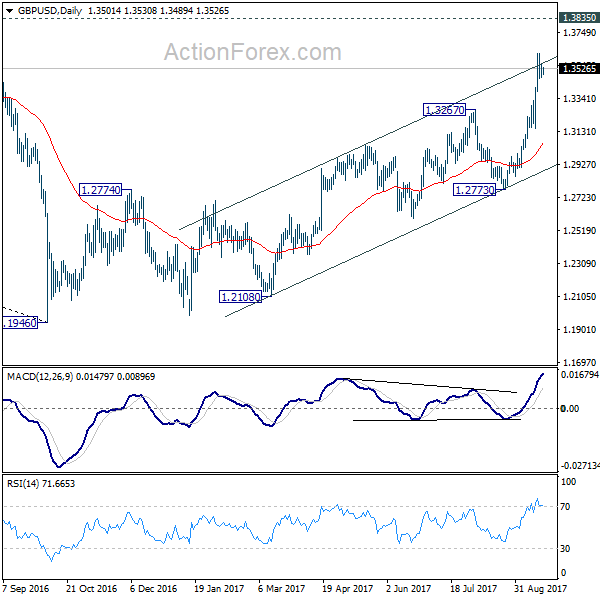
In the bigger picture, as noted before, GBP/USD hit strong resistance from the long term falling trend line. Current development is starting to favor that corrective rebound from 1.1946 low has completed at 1.3651. Decisive break of 1.2773 will confirm this bearish case and target a test on 1.1946 low next, with prospect of resuming the low term down trend. Nonetheless, break of 1.3320 resistance will restore the rise from 1.1946 for 38.2% retracement of 2.1161 (2007 high) to 1.1946 (2016 low) at 1.5466.