GBP/USD Mid-Day Outlook

Daily Pivots: (S1) 1.3341; (P) 1.3372; (R1) 1.3414; More…..

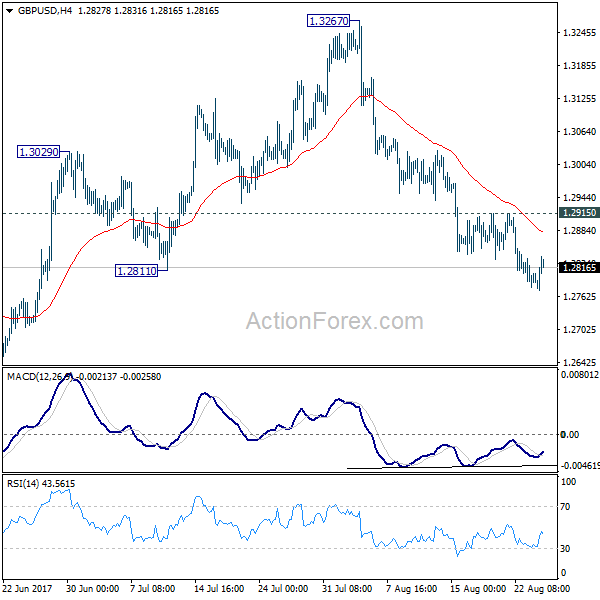
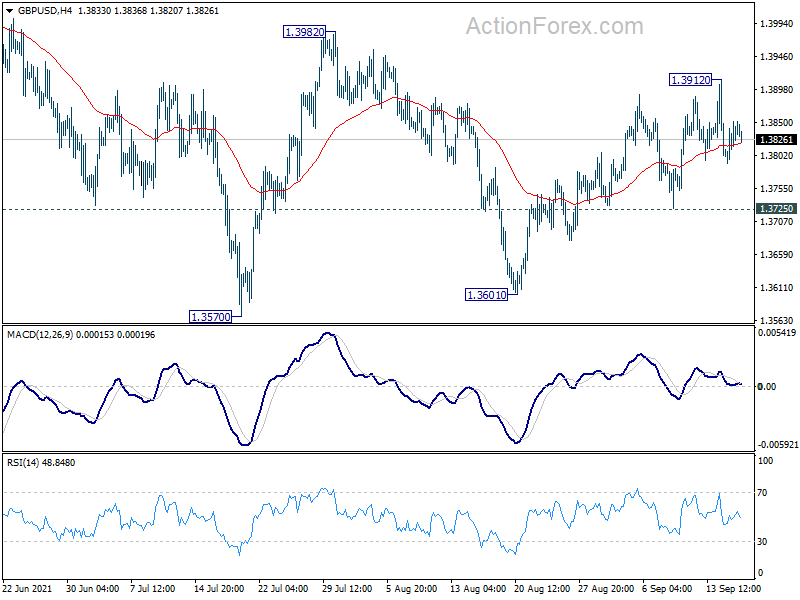
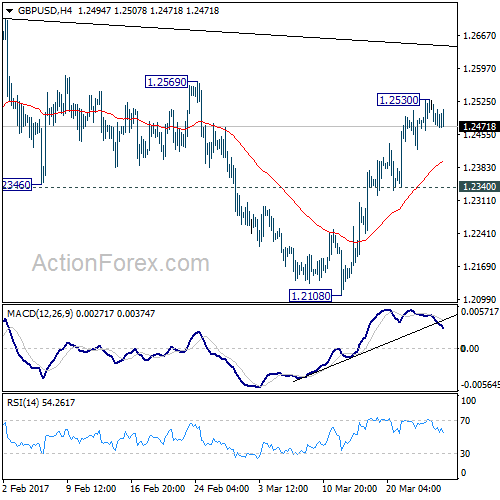
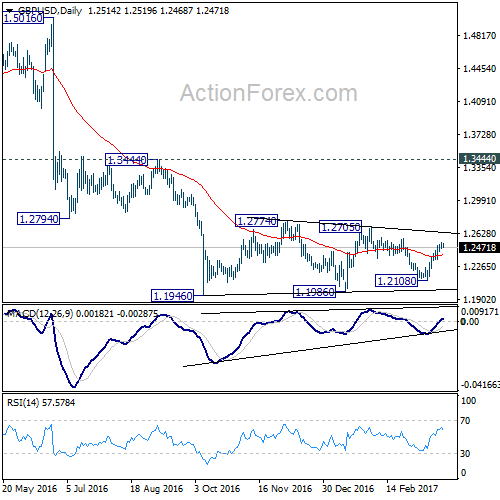
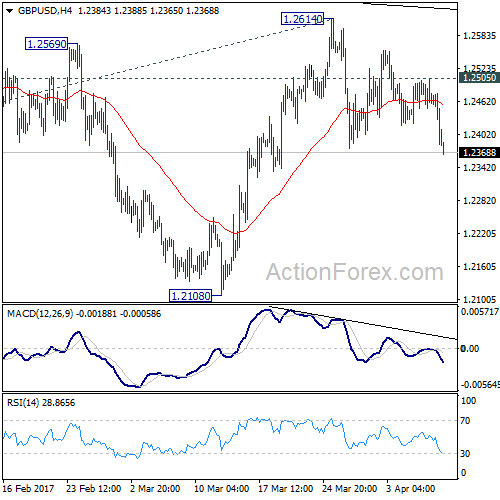
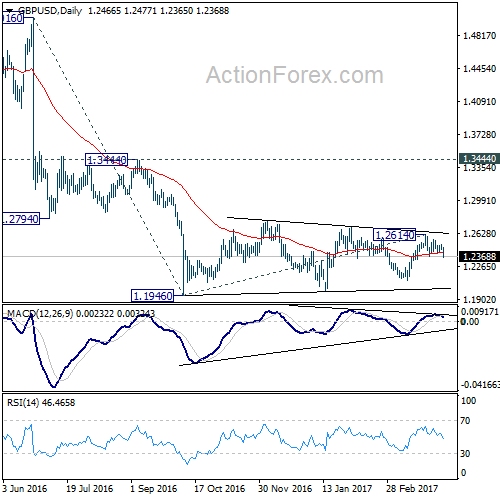
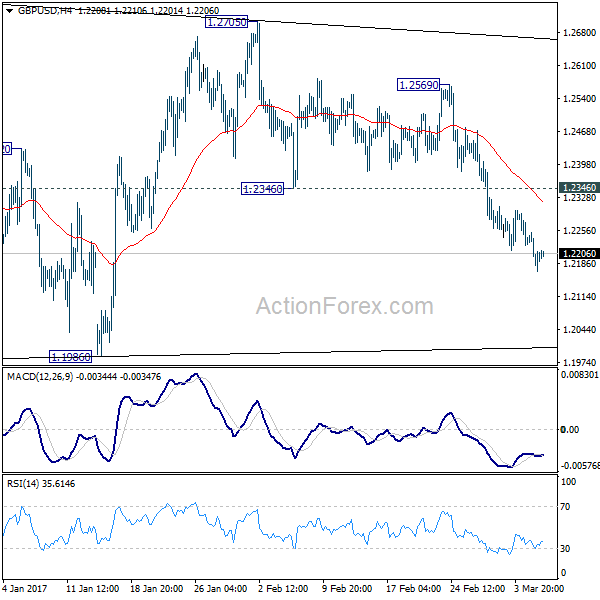
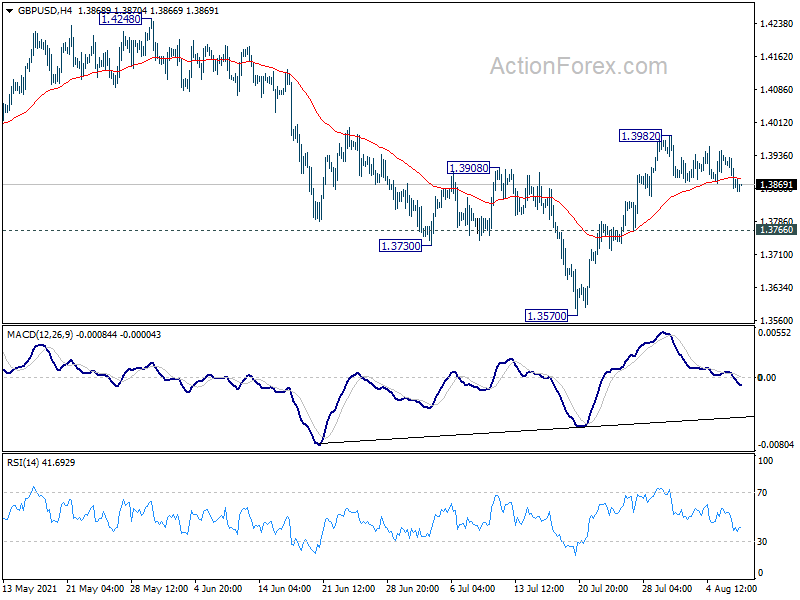
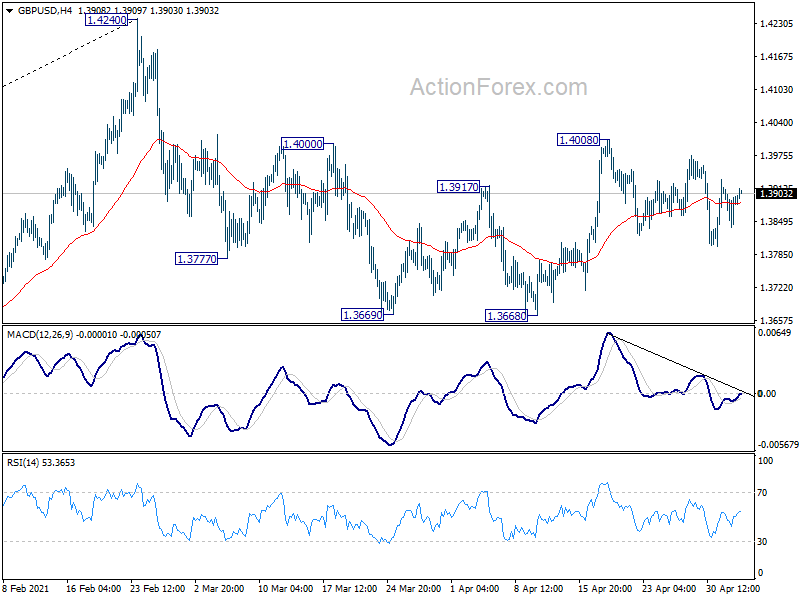
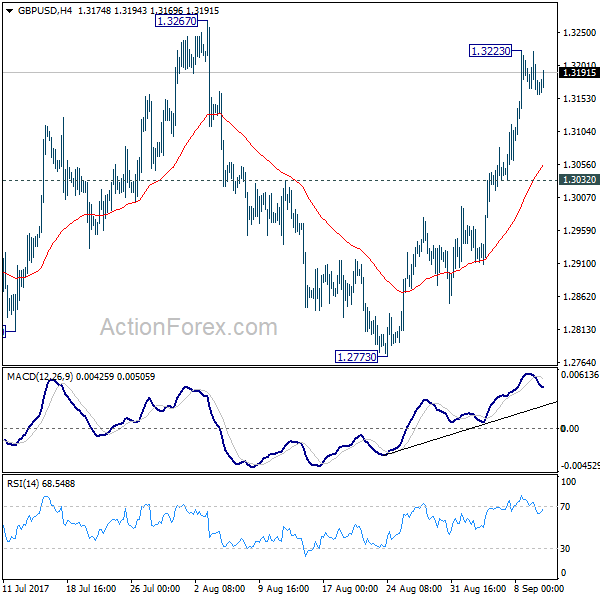
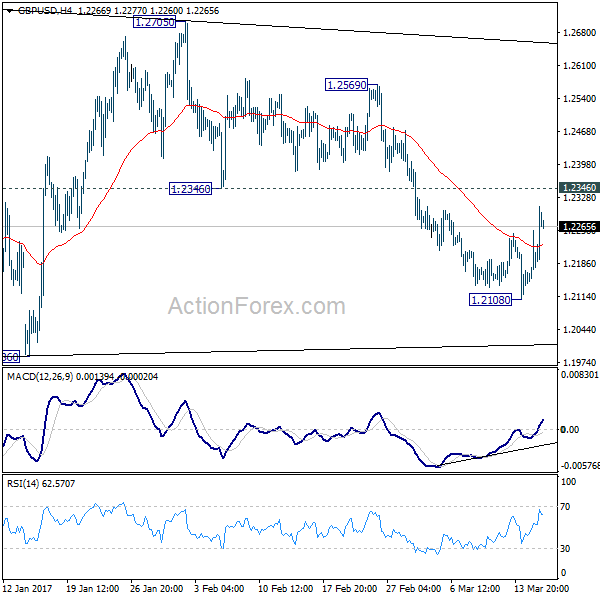
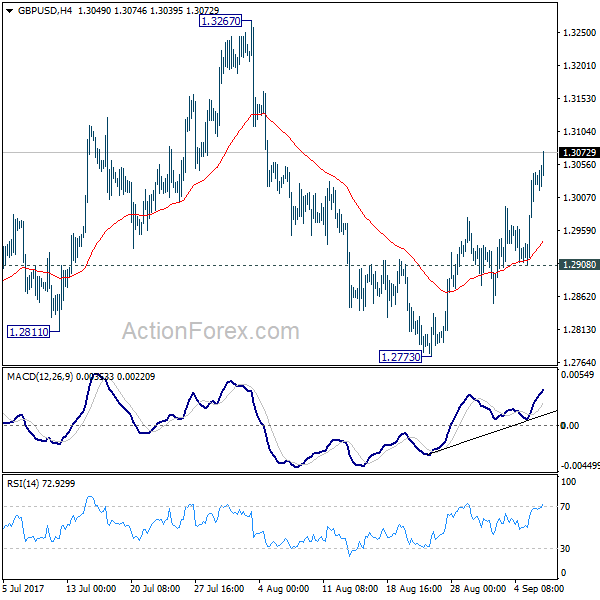
GBP/USD is staying in the correction from 1.3549 and intraday bias stays neutral for the moment. As long as 1.3220 support holds, we’d favor another rise. Break of 1.3549 will target 1.3651 high next. Break there will resume medium term rally from 1.1946. However, firm break of 1.3220 will turn near term outlook bearish for 1.3038 key support level.

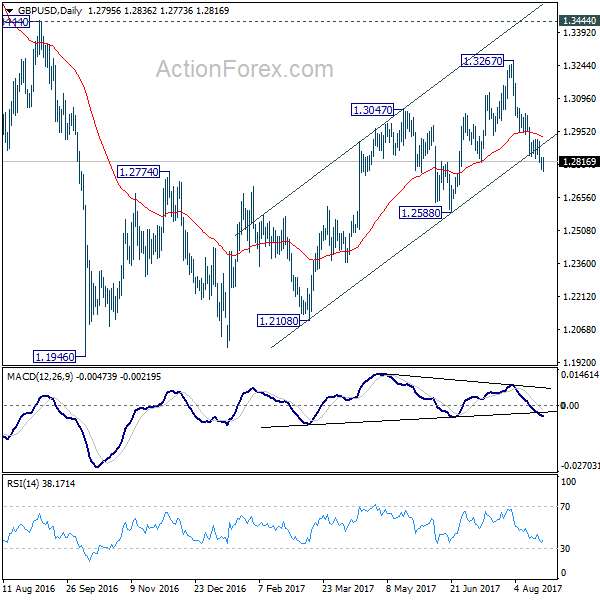
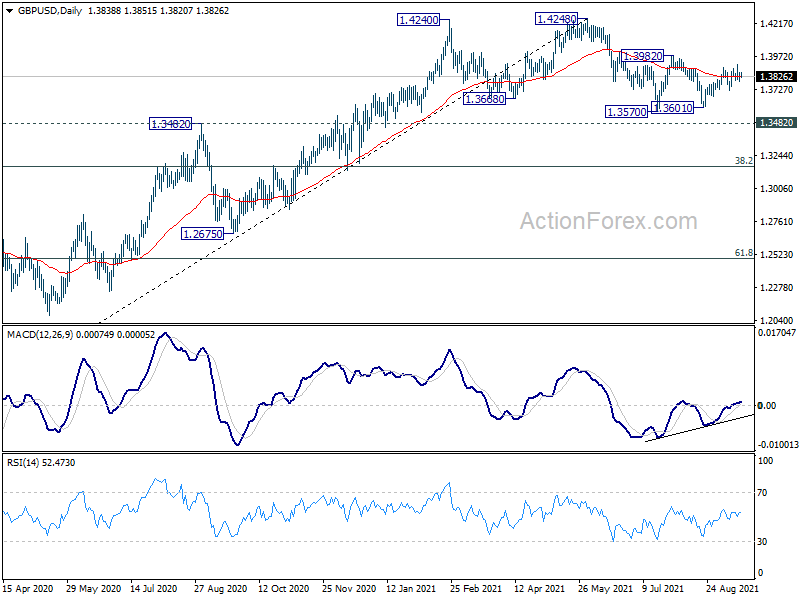
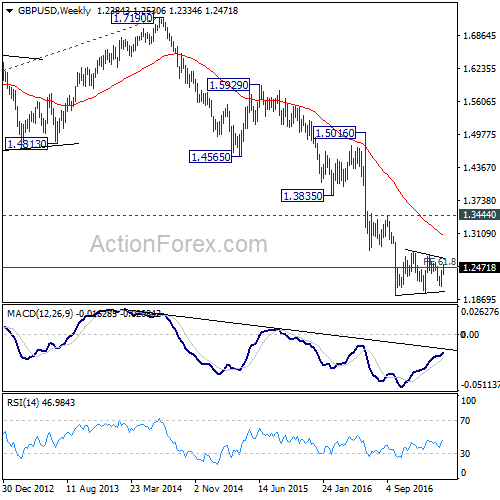
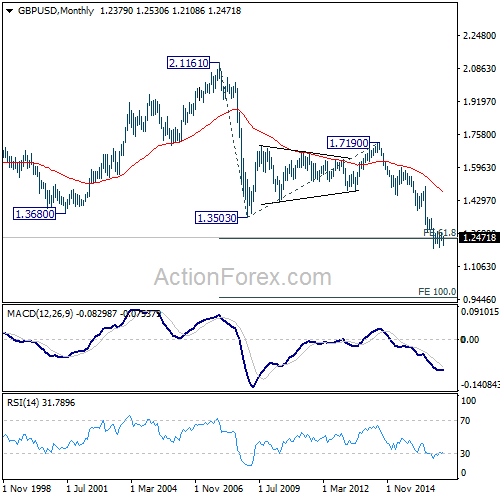
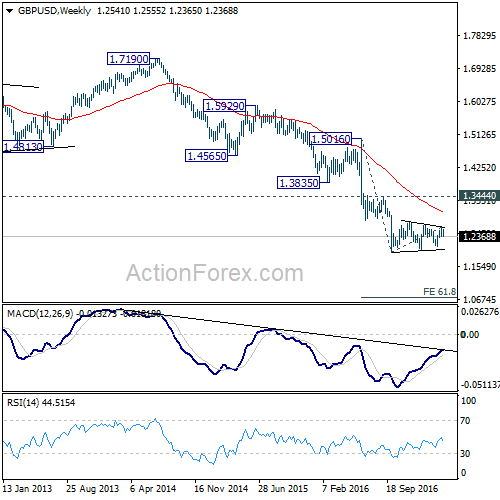
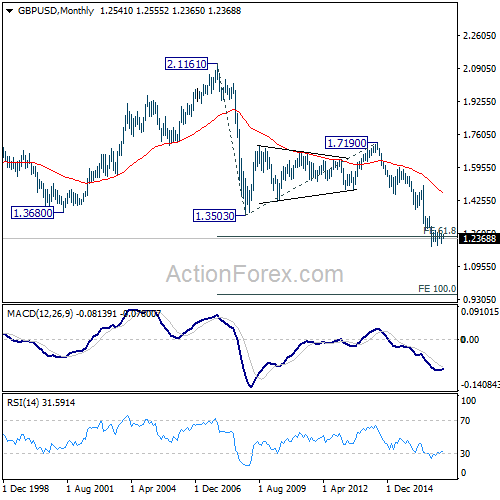
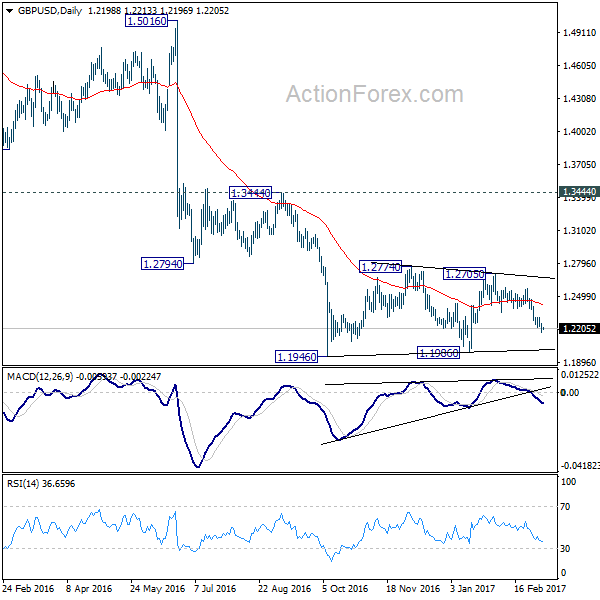
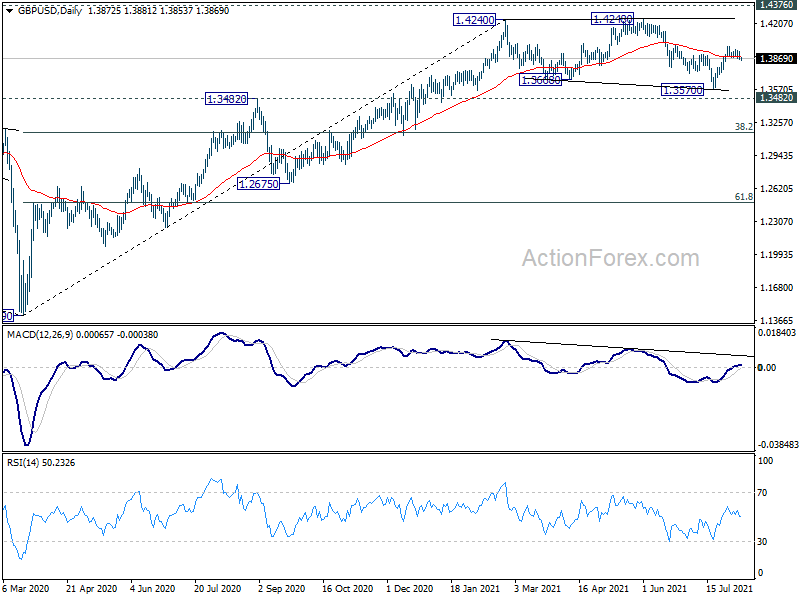
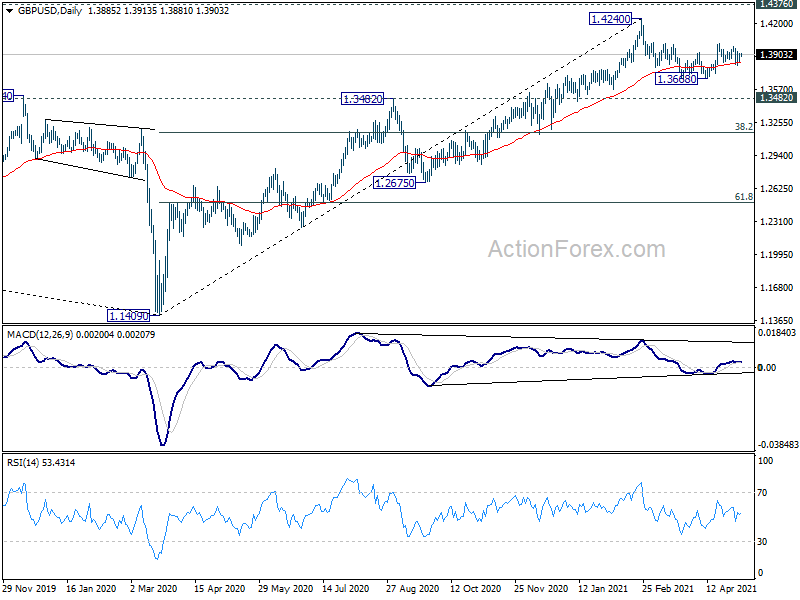
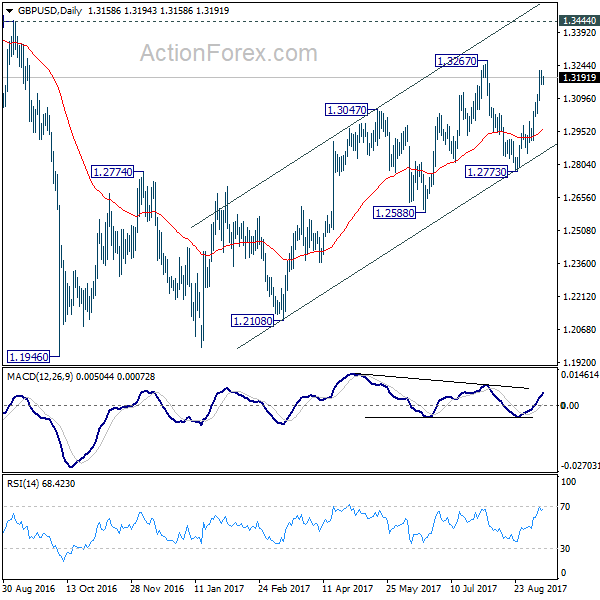
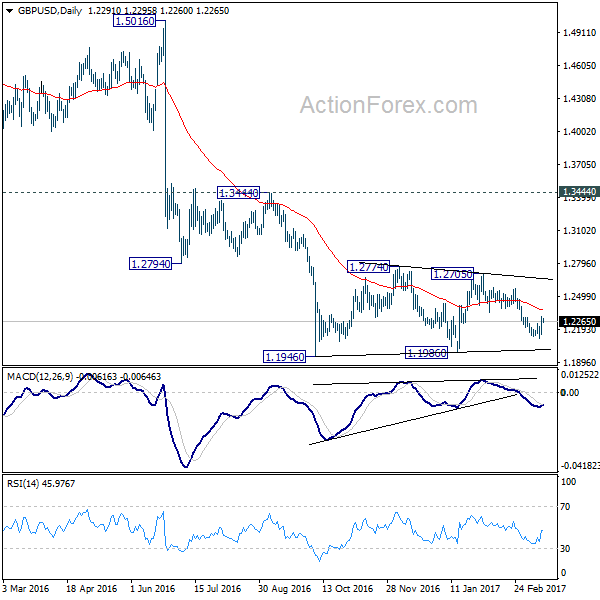
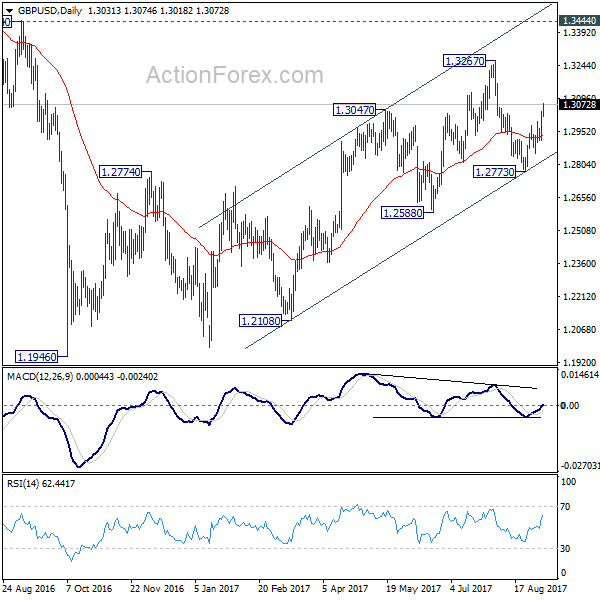
In the bigger picture, while the medium term rebound from 1.1946 low was strong, it’s limited below 1.3835 key support turned resistance. As long as 1.3835 holds, we’d view such rebound as a correction. That is, we’d expect another leg in the long term down trend through 1.1946 low. However, sustained break of 1.3835 should at least send GBP/USD to 38.2% retracement of 2.1161 (2007 high) to 1.1946 (2016 low) at 1.5466.

GBP/USD 4 Hours Chart

GBP/USD Daily Chart

GBP/USD Mid-Day Outlook

Daily Pivots: (S1) 1.2774; (P) 1.2803; (R1) 1.2828; More

GBP/USD lost some downside momentum again but still, further decline is expected with 1.2915 resistance. Current fall from 1.3267 should be targeting to 1.2588 key near term support. As noted before, we’re favoring the case that correction from 1.1946 is completed at 1.3267. Decisive break of 1.2588 will confirm our view and target a test on 1.1946 low. Though, break of 1.2915 will indicate short term bottoming and bring stronger rebound.

In the bigger picture, overall, price actions from 1.1946 medium term low are seen as a corrective pattern. While further rise cannot be ruled out, larger outlook remains bearish as long as 1.3444 key resistance holds. Down trend from 1.7190 (2014 high) is expected to resume later after the correction completes. And break of 1.2588 will indicate that such down trend is resuming.

GBP/USD 4 Hours Chart

GBP/USD Daily Chart

GBP/USD Daily Outlook

Daily Pivots: (S1) 1.2850; (P) 1.2875; (R1) 1.2908; More

Intraday bias in GBP/USD remains neutral for the moment. With 1.2830 minor support intact, another rise could be seen. However, firstly, price actions from 1.1946 are viewed as a corrective pattern. Secondly, bearish divergence condition is seen in 4 hour MACD. Hence, in case of another rise, we’d start to look for reversal signal again above 1.2987. Meanwhile, break of 1.2830 will indicate short term topping. In such case, intraday bias is turned back to the downside for 1.2614 resistance turned support first.

In the bigger picture, fall from 1.7190 is seen as part of the down trend from 2.1161. There is no sign of medium term reversal yet. Sustained trading below 61.8% projection of 2.1161 to 1.3503 from 1.7190 at 1.2457 will target 100% projection at 0.9532. Overall, break of 1.3444 resistance is needed to confirm medium term bottoming. Otherwise, outlook will remain bearish.

GBP/USD 4 Hours Chart

GBP/USD Daily Chart

GBP/USD Daily Outlook

Daily Pivots: (S1) 1.3351; (P) 1.3397; (R1) 1.3436; More….

Intraday bias in GBP/USD remains neutral as it’s staying in corrective pull back from 1.3549, held above 1.3337 resistance turned support. As long as 1.3337 remains intact, further rise is expected. Break of 1.3549 will target 1.3651 high and above. However, decisive break of 1.3337 will argue that rise from 1.3038 has completed and turn bias back to the downside for this support.

In the bigger picture, while the medium term rebound from 1.1946 low is strong, it’s still limited below 1.3835 key support turned resistance. As long as 1.3835 holds, we’d view such rebound as a correction. That is, we’d expect another leg in the long term down trend through 1.1946 low. However, sustained break of 1.3835 should at least send GBP/USD to 38.2% retracement of 2.1161 (2007 high) to 1.1946 (2016 low) at 1.5466.

GBP/USD 4 Hours Chart

GBP/USD Daily Chart

GBP/USD Daily Outlook

Daily Pivots: (S1) 1.3805; (P) 1.3830; (R1) 1.3866; More

Intraday bias in GBP/USD stays neutral and outlook is unchanged. On the upside, break of 1.3912 will target 1.3982 resistance next. Decisive break there will indicate that fall from 1.4248 has completed. Stronger rally would then be seen back to 1.4248 high. On the downside, however, break of 1.3725 support will turn bias back to the downside for retesting 1.3570/3601 support zone instead.

In the bigger picture, as long as 1.3482 resistance turned support holds, we’d still treat price actions from 1.4248 as a corrective move. That is, up trend from 1.1409 (2020 low) is in favor to resume. Decisive break of 1.4376 key resistance (2018 high) would indeed carry long term bullish implications. However, sustained break of 1.3482 will at least bring deeper fall to 38.2% retracement of 1.1409 to 1.4248 at 1.3164, or even further to 61.8% retracement at 1.2493.

GBP/USD Daily Outlook

Daily Pivots: (S1) 1.2342; (P) 1.2373; (R1) 1.2423; More

GBP/USD’s rebound from 1.2108 is still in progress and intraday bias remains on the upside for 1.2569 resistance. Current development suggests that consolidation pattern from 1.1946 is extending with another rising leg. And the larger down trend is not ready to resume yet. Break of 1.2569 will target .2705/74 resistance zone next. At this point, we’d expect strong resistance from 1.2705/2774 to limit upside to extend the sideway pattern. Break of 1.2240 minor support will turn bias back to the downside for 1.2108 support. Though, sustained break of 1.2774 will extend the rise towards 1.3444 key resistance level.

In the bigger picture, fall from 1.7190 is seen as part of the down trend from 2.1161. There is no sign of medium term bottoming yet. Sustained trading below 61.8% projection of 2.1161 to 1.3503 from 1.7190 at 1.2457 will target 100% projection at 0.9532. Overall, break of 1.3444 resistance is needed to confirm medium term bottoming. Otherwise, outlook will remain bearish.

GBP/USD 4 Hours Chart

GBP/USD Daily Chart

GBP/USD Weekly Outlook

GBP/USD rebounded to as high as 1.2530 last week but lost momentum since then. Overall outlook is unchanged that price actions from 1.1946 are developing into consolidation pattern with 1.2108 as another leg. While such consolidation could extend, the larger down trend is expected to resume at a later stage.

GBP/USD 4 Hours Chart

Initial bias in GBP/USD is neutral this week first. On the upside, above 1.2530 will target 1.2705/74 resistance zone. But we’d expect strong resistance from 1.2705/2774 resistance zone to limit upside and bring down trend resumption. On the downside, break of 1.2340 support will turn bias back to the downside for 1.2108 support. Though, sustained break of 1.2774 will extend the rise towards 1.3444 key resistance level.

GBP/USD Daily Chart

In the bigger picture, fall from 1.7190 is seen as part of the down trend from 2.1161. There is no sign of medium term reversal yet. Sustained trading below 61.8% projection of 2.1161 to 1.3503 from 1.7190 at 1.2457 will target 100% projection at 0.9532. Overall, break of 1.3444 resistance is needed to confirm medium term bottoming. Otherwise, outlook will remain bearish.

GBP/USD Weekly Chart

In the longer term picture, no change in the view that down trend from 2.1161 is still in progress. Current momentum suggests that the down trend will go deeper than originally expected to 100% projection of 2.1161 to 1.3503 from 1.7190 at 0.9532.

GBP/USD Monthly Chart

GBP/USD Weekly Outlook

GBP/USD’s sharp fall and break of 1.2376 support last week should confirm completion of rise from 1.2108 at 1.2614. More importantly, the triangle pattern from 1.1946 could be finished with five waves to 1.2614 too. And the larger down trend is resuming. Deeper fall should be seen back to 1.2108 support to confirm this bearish case.

GBP/USD 4 Hours Chart

Initial bias in GBP/USD remains on the downside this week for 1.2108 support first. Decisive break there will argue that medium term down trend is resuming. In that case, GBP/USD should take out 1.1946/1986 support zone to 61.8% projection of 1.5016 to 1.1946 from 1.2614 at 1.0717. On the upside, however, break of 1.2505 resistance will invalidate this immediately bearish case. Then, it will turn bias back to the upside for 1.2614 resistance instead.

GBP/USD Daily Chart

In the bigger picture, fall from 1.7190 is seen as part of the down trend from 2.1161. There is no sign of medium term reversal yet. Sustained trading below 61.8% projection of 2.1161 to 1.3503 from 1.7190 at 1.2457 will target 100% projection at 0.9532. Overall, break of 1.3444 resistance is needed to confirm medium term bottoming. Otherwise, outlook will remain bearish.

GBP/USD Weekly Chart

In the longer term picture, no change in the view that down trend from 2.1161 is still in progress. Current momentum suggests that the down trend will go deeper than originally expected to 100% projection of 2.1161 to 1.3503 from 1.7190 at 0.9532.

GBP/USD Monthly Chart

GBP/USD Daily Outlook

Daily Pivots: (S1) 1.2961; (P) 1.3002; (R1) 1.3039; More

GBP/USD’s consolidative pattern from 1.3047 is still extending and intraday bias remains neutral. As long as 1.2844 minor support holds, further rise remains mildly in favor. Nonetheless, as we are still viewing price actions from 1.1946 as a corrective move, we’d expect upside to be limited below 1.3444 resistance to bring near term reversal. On the downside, break of 1.2844 will indicate short term topping and turn bias back to the downside for 1.2614 resistance turned support first.

In the bigger picture, fall from 1.7190 is seen as part of the down trend from 2.1161. There are signs of reversal, like breaking of 55 week EMA, weekly MACD turned positive, and monthly MACD crossed above signal line. But still, break of 1.3444 resistance is need to confirm medium term bottoming. Otherwise, outlook will remains bearish for extend the down trend through 1.1946 low.

GBP/USD 4 Hours Chart

GBP/USD Daily Chart

GBP/USD Daily Outlook

Daily Pivots: (S1) 1.2163; (P) 1.2207; (R1) 1.2246; More

Intraday bias in GBP/USD remains on the downside as decline from 1.2705 continues. Current fall should target a test on 1.1946/86 support zone. As noted before, consolidation pattern from 1.1946 should have completed with three waves to 1.2705 already. Break of 1.1946 will confirm our bearish view and resume the larger down trend. On the upside, break of 1.2346 support turned resistance is needed to invalidate this view. Otherwise, outlook will remain cautiously bearish in case of recovery.

In the bigger picture, fall from 1.7190 is seen as part of the down trend from 2.1161. There is no sign of medium term bottoming yet. Sustained trading below 61.8% projection of 2.1161 to 1.3503 from 1.7190 at 1.2457 will target 100% projection at 0.9532. Overall, break of 1.3444 resistance is needed to confirm medium term bottoming. Otherwise, outlook will remain bearish.

GBP/USD 4 Hours Chart

GBP/USD Daily Chart

GBP/USD Weekly Outlook

GBP/USD stayed in consolidation below 1.4345 last week and outlook is unchanged. Initial bias remains neutral this week first. In case of another fall, downside should be contained by 1.3915 support to bring rally resumption. On the upside, break of 1.4345 will resume medium term up trend to 100% projection of 1.2108 to 1.3651 from 1.3038 at 1.4581 next. However, break of 1.3915 will argue that, at least, deeper pull back in underway to 1.3651 resistance turned support.

In the bigger picture, sustained break of 1.3835 key resistance level indicates that rebound from 1.1946 is at least correcting the long term down from from 2007 high at 2.1161. Further rise should now be seen back to 38.2% retracement of 2.1161 (2007 high) to 1.1946 (2016 low) at 1.5466. Medium term outlook will stay bullish as long as 1.3038 support holds, in case of pull back.

In the longer term picture, rise from 1.1946 should at least be correcting the whole long term down trend form 2.1161 and should target 38.2% retracement of 2.1161 (2007 high) to 1.1946 (2016 low) at 1.5466. It too early to tell if it’s developing into a long term up trend. We’ll monitor the upside momentum and reaction to 1.5466 to decide later.

GBP/USD 4 Hours Chart

GBP/USD Daily Chart

GBP/USD Weekly Chart

GBP/USD Monthly Chart

GBP/USD Daily Outlook

Daily Pivots: (S1) 1.3845; (P) 1.3890; (R1) 1.3919; More

Intraday bias in GBP/USD remains neutral first. Further rise is expected as long as 1.3766 support holds. Corrective pattern from 1.4240 could have completed with three waves down to 1.3570. On the upside, break of 1.3982 will resume the rise from 1.3570 to retest 1.4248 high. However, break of 1.3766 support will dampen this bullish view and bring retest of 1.3570.

In the bigger picture, as long as 1.3482 resistance turned support holds, up trend from 1.1409 should still continue. Decisive break of 1.4376 resistance will carry larger bullish implications. However, firm break of 1.3482 support will argue that the rise from 1.1409 has completed. GBP/USD would then be seen in another leg of long term range pattern between 1.1409 and 1.4376. Deeper fall could then be seen to 61.8% retracement of 1.1409 to 1.4248 at 1.2493, and even below.

GBP/USD Daily Outlook

Daily Pivots: (S1) 1.3845; (P) 1.3880; (R1) 1.3922; More

No change in GBP/USD’s outlook and intraday bias remains neutral. On the upside, break of 1.4008 resistance should reaffirm the bullish case that correction from 1.4240 has completed. Further rise should be seen back to retest 1.4240 high. However, break of 1.3668 will extend the correction from 1.4240 with another falling leg.

In the bigger picture, as long as 1.3482 resistance turned support holds, up trend from 1.1409 should still continue. Decisive break of 1.4376 resistance will carry larger bullish implications and target 38.2% retracement of 2.1161 (2007 high) to 1.1409 (2020 low) at 1.5134. However, firm break of 1.3482 support will argue that the rise from 1.1409 has completed and bring deeper fall to 1.2675 support and below.

GBP/USD Daily Outlook

Daily Pivots: (S1) 1.2859; (P) 1.2887; (R1) 1.2925; More

A temporary low is in place at 1.2830 and intraday bias in GBP/USD is turned neutral first. Some consolidation could be seen but upside should be limited by 1.3030 resistance to bring fall resumption. As noted before, we’re favoring the case that correction from 1.1946 is completed at 1.3267. Below 1.2830 will target 1.2588 key near term support. Decisive break of 1.2588 will confirm our view and target a test on 1.1946 low.

In the bigger picture, overall, price actions from 1.1946 medium term low are seen as a corrective pattern. While further rise cannot be ruled out, larger outlook remains bearish as long as 1.3444 key resistance holds. Down trend from 1.7190 (2014 high) is expected to resume later after the correction completes. And break of 1.2588 will indicate that such down trend is resuming.

GBP/USD 4 Hours Chart

GBP/USD Daily Chart

GBP/USD Daily Outlook

Daily Pivots: (S1) 1.3141; (P) 1.3182; (R1) 1.3203; More

A temporary top is in place at 1.3223 in GBP/USD and intraday bias is turned neutral first. Further rally is expected as long as 1.3032 support holds. Above 1.3223 will target 1.3267 first. Break will resume whole rise from 1.1946 and target 1.3444 key resistance next. But again, price actions from 1.1946 are still seen as a corrective pattern. Hence, we’d expect strong resistance from 1.3444 to limit upside to bring larger down trend reversal eventually. On the downside, break of 1.3032 will indicate near term reversal and turn bias back to the downside for 1.2773 support instead.

In the bigger picture, overall, price actions from 1.1946 medium term low are seen as a corrective pattern. While further rise cannot be ruled out, larger outlook remains bearish as long as 1.3444 key resistance holds. Down trend from 1.7190 (2014 high) is expected to resume later after the correction completes. And break of 1.2773 support will be the first sign that such down trend is resuming.

GBP/USD 4 Hours Chart

GBP/USD Daily Chart

GBP/USD Mid-Day Outlook

Daily Pivots: (S1) 1.2868; (P) 1.2909; (R1) 1.2946; More

Intraday bias in GBP/USD remains neutral for the moment. On the downside, below 1.2768 minor support will extend the fall from 1.3047 to 1.2614 resistance turned support. Decisive break there should confirm completion of the consolidation pattern from 1.1946 and resume the larger down trend through this low. On the upside, break of 1.3047 will extend the correction with another rise towards 1.3444 key resistance.

In the bigger picture, fall from 1.7190 is seen as part of the down trend from 2.1161. The rejection from 55 week EMA is maintaining bearishness in the pair. Also, at this point, as long as 1.3444 resistance holds, fall from 1.7190 is still expected to continue. Break of above mentioned 1.2614 support will affirm this bearish case.

GBP/USD 4 Hours Chart

GBP/USD Daily Chart

GBP/USD Mid-Day Outlook

Daily Pivots: (S1) 1.2205; (P) 1.2308; (R1) 1.2364; More

With 1.2188 minor support intact, rebound from 1.1986 could still extend higher through 1.2432 resistance. But still, such rise is seen as the third leg of the consolidation pattern from 1.1946. Thus, we’d expect strong resistance at 1.2774 to limit upside and bring down trend resumption eventually. On the downside, below 1.2188 minor support will turn bias to the downside for retesting 1.1946 low.

In the bigger picture, fall from 1.7190 is seen as part of the down trend from 2.1161. There is no sign of medium term bottoming yet. Sustained trading below 61.8% projection of 2.1161 to 1.3503 from 1.7190 at 1.2457 will target 100% projection at 0.9532. Overall, break of 1.3444 resistance is needed to confirm medium term bottoming. Otherwise, outlook will remain bearish.

GBP/USD 4 Hours Chart

GBP/USD Daily Chart

Subscribe to our daily and mid-day newsletter to get this report delivered to your mail box

GBP/USD Mid-Day Outlook

Daily Pivots: (S1) 1.2598; (P) 1.2640; (R1) 1.2667; More…

Intraday bias in GBP/USD remains neutral and outlook is unchanged. On the upside, break of 1.2708 resistance will indicate that correction from 1.2826 has completed. Intraday bias will be back on the upside for retesting 1.2826. Nevertheless, decisive break of 1.2499 will argue that whole rise from 1.2036 has completed and turn near term outlook bearish.

In the bigger picture, price actions from 1.3141 medium term top are seen as a corrective pattern to up trend from 1.0351 (2022 low). Rise from 1.2036 is seen as the second leg, which could be still in progress. But upside should be limited by 1.3141 to bring the third leg of the pattern. Meanwhile, break of 1.2499 support will argue that the third leg has already started for 38.2% retracement of 1.0351 (2022 low) to 1.3141 at 1.2075 again.

GBP/USD Daily Outlook

Daily Pivots: (S1) 1.2183; (P) 1.2246; (R1) 1.2350; More

GBP/USD’s recovery from 1.2108 continues today but stays below 1.2346 support turned resistance. Intraday bias stays neutral for the moment. Near term outlook remains bearish as long as 1.2346 support turned resistance holds. As noted before, consolidation pattern from 1.1946 is completed at 1.2705 is resuming larger down trend. Below 1.2108 will target a test on 1.1946/86 support zone. Break of 1.1946 will confirm our bearish view. However, sustained break of 1.2346 will turn bias to the upside for 1.2705 resistance to extend the consolidation from 1.1946.

In the bigger picture, fall from 1.7190 is seen as part of the down trend from 2.1161. There is no sign of medium term bottoming yet. Sustained trading below 61.8% projection of 2.1161 to 1.3503 from 1.7190 at 1.2457 will target 100% projection at 0.9532. Overall, break of 1.3444 resistance is needed to confirm medium term bottoming. Otherwise, outlook will remain bearish.

GBP/USD 4 Hours Chart

GBP/USD Daily Chart

GBP/USD Mid-Day Outlook

Daily Pivots: (S1) 1.2945; (P) 1.2993; (R1) 1.3079; More

Intraday bias in GBP/USD remains on the upside for 1.3267. Break will target 1.3444 key resistance level next. Price actions from 1.1946 are still seen as a corrective pattern. Hence, we’d expect strong resistance from 1.3444 to limit upside to bring larger down trend reversal eventually. On the downside, below 1.2908 minor support will turn bias back to the downside for 1.2773.

In the bigger picture, overall, price actions from 1.1946 medium term low are seen as a corrective pattern. While further rise cannot be ruled out, larger outlook remains bearish as long as 1.3444 key resistance holds. Down trend from 1.7190 (2014 high) is expected to resume later after the correction completes. And break of 1.2588 will indicate that such down trend is resuming.

GBP/USD 4 Hours Chart

GBP/USD Daily Chart