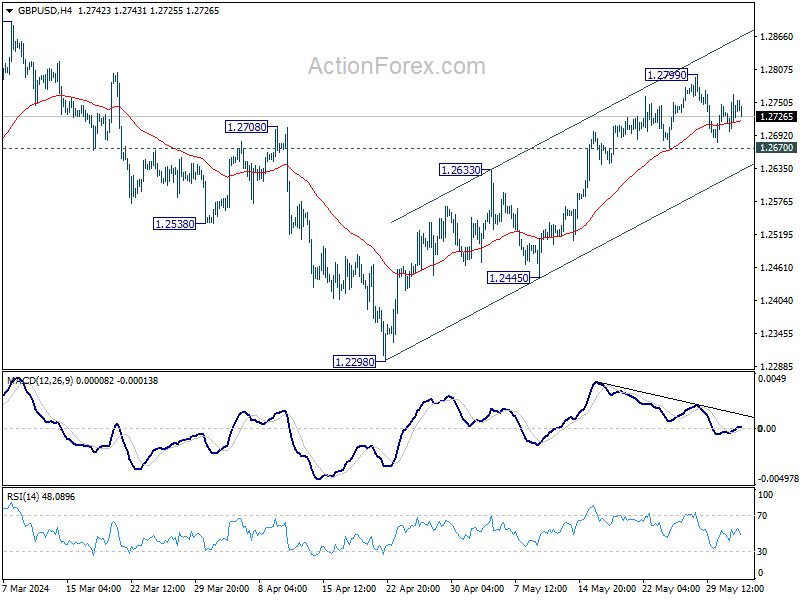
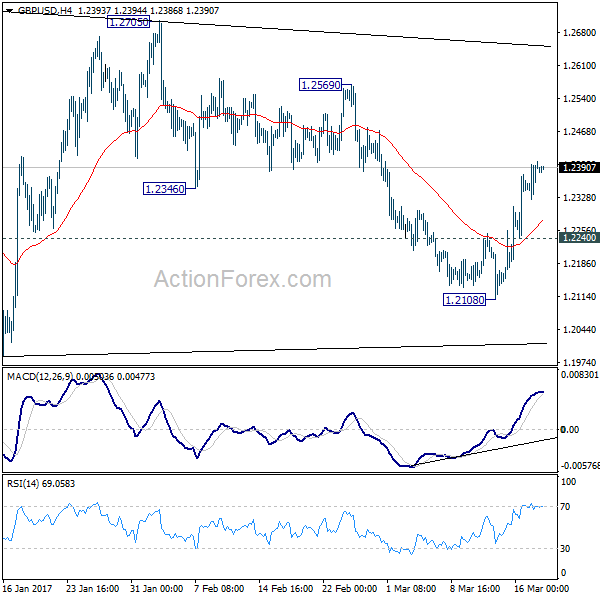
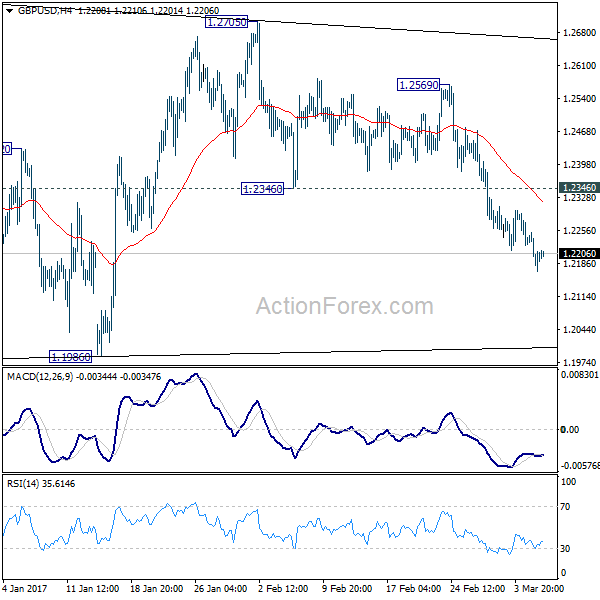
Daily Pivots: (S1) 1.2693; (P) 1.2721; (R1) 1.2760; More…
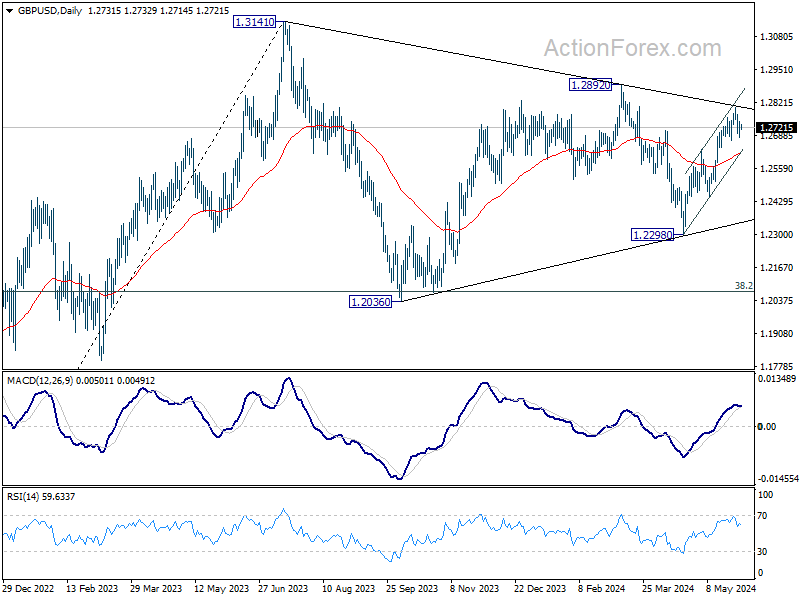
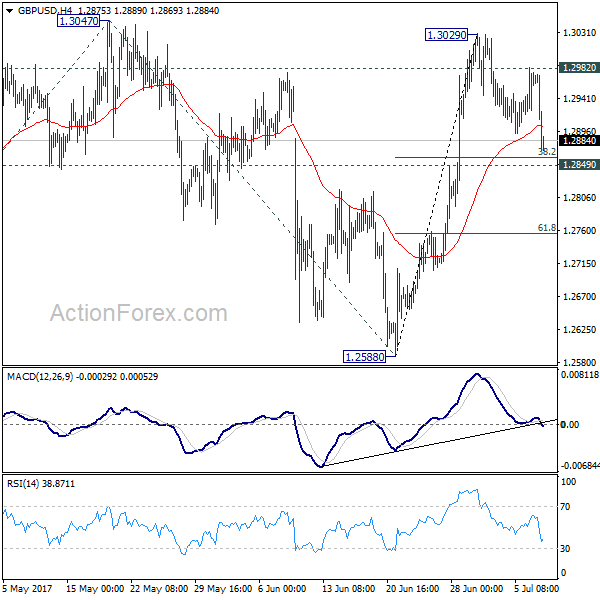
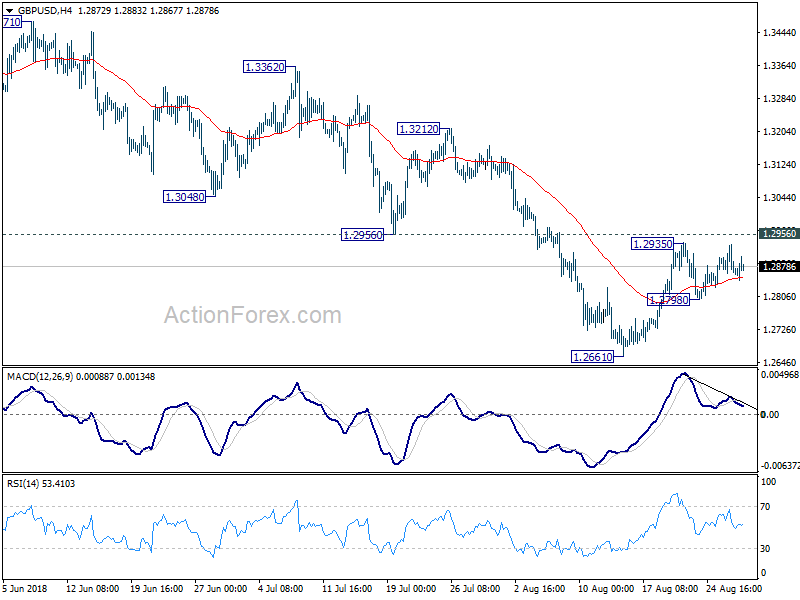
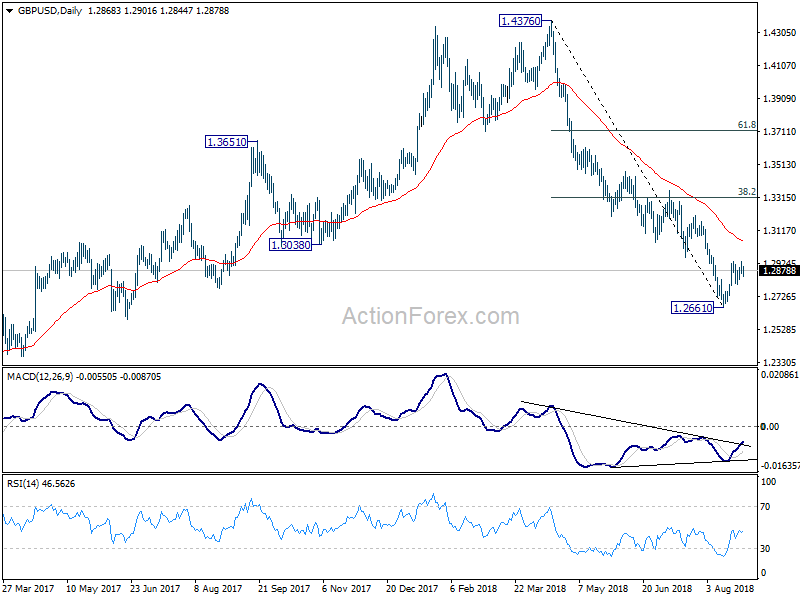
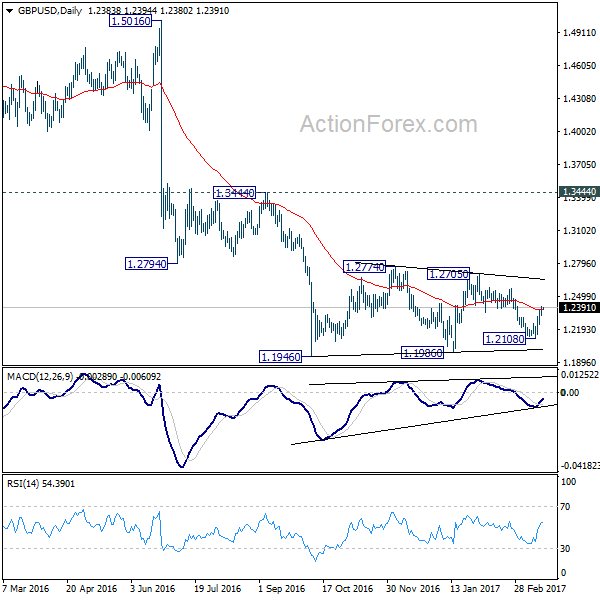
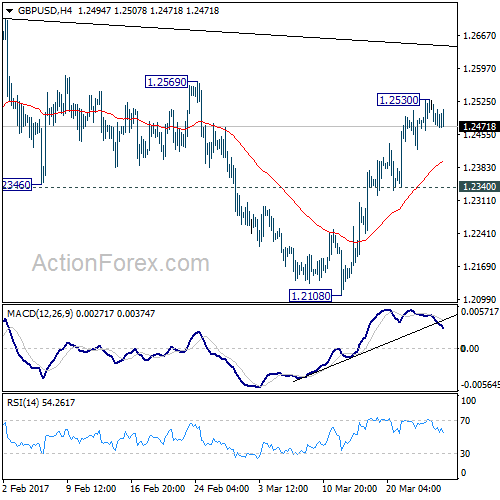
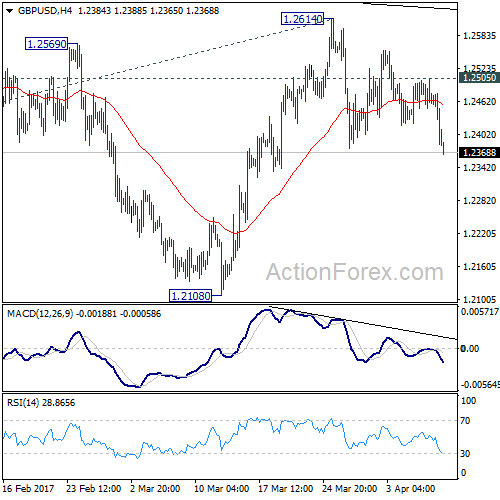
Intraday bias in GBP/USD remains neutral at this point and some more consolidations could be seen. Further rise is expected as long as 1.2670 support holds. Above 1.2799 will resume the rally from 1.2298 and target 1.2892 resistance. However, break of 1.2670 will indicate short term topping, and turn bias back to the downside for deeper pullback.
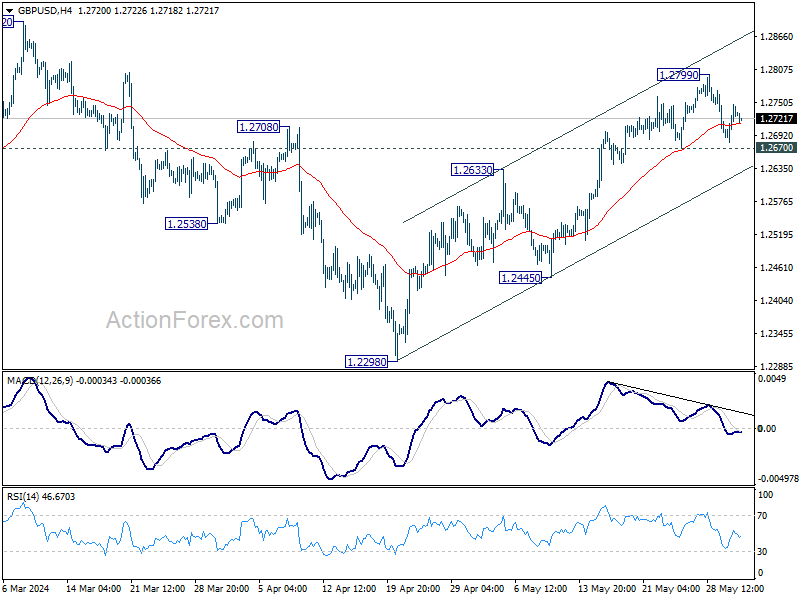
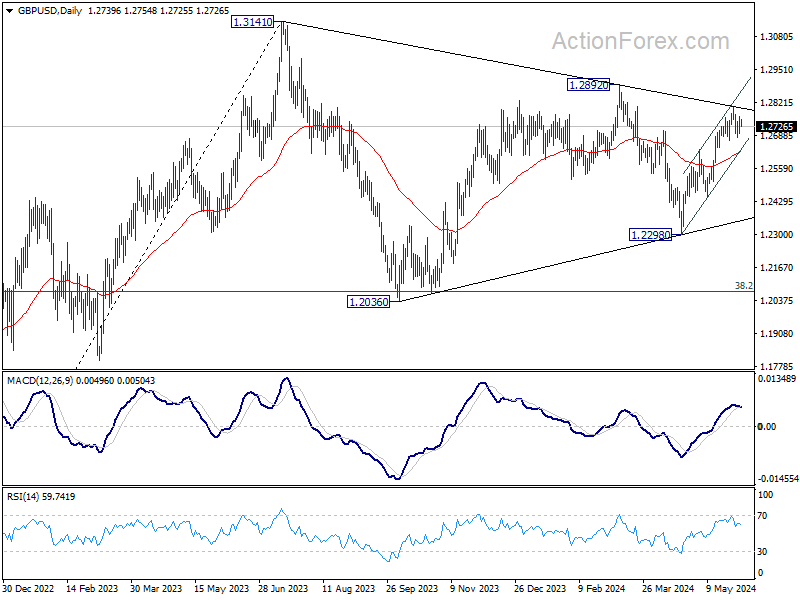
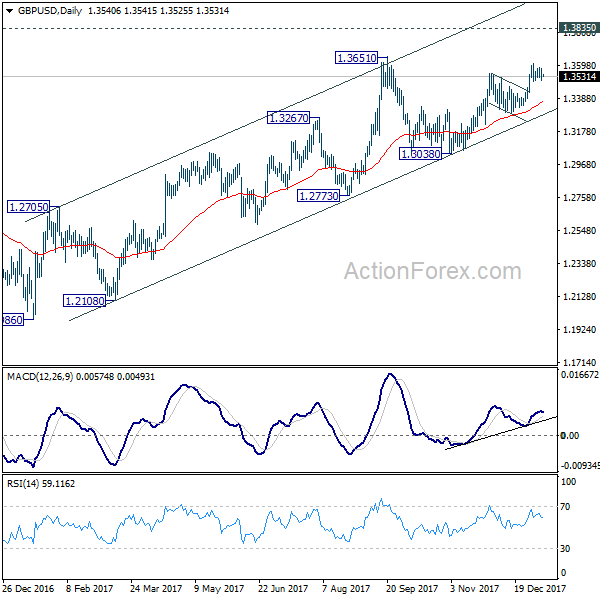
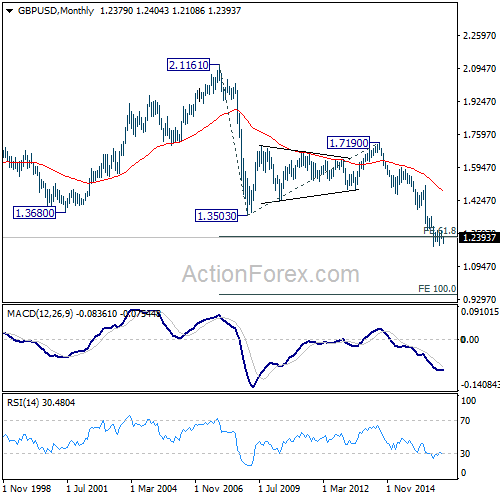
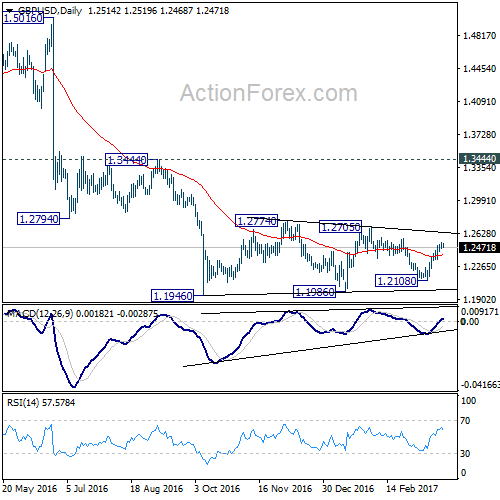
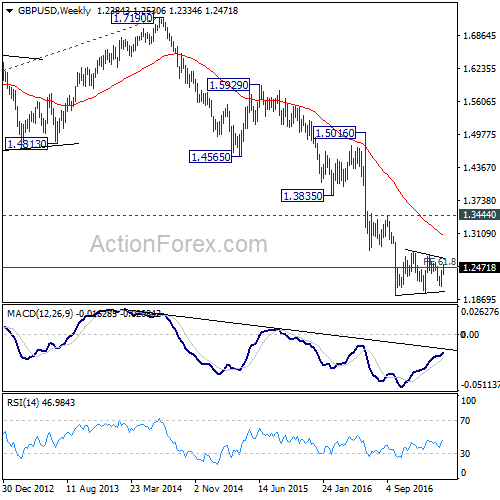
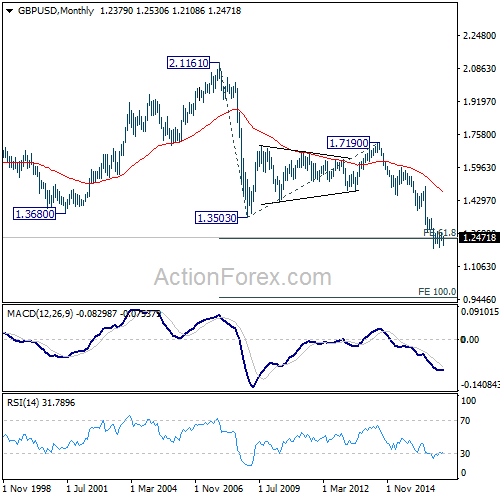
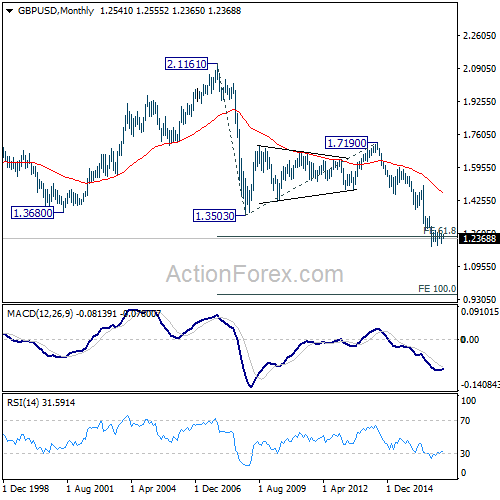
In the bigger picture, price actions from 1.3141 medium term top are seen as a corrective pattern. Fall from 1.2892 is seen as the third leg which might have completed already. Break of 1.2892 resistance will argue that larger up trend from 1.0351(2022 low) is ready to resume through 1.3141. Meanwhile, break of 1.2445 support will extend the corrective pattern with another decline instead.