GBPJPY Outlook
GBP/JPY Daily Outlook
Daily Pivots: (S1) 207.73; (P) 209.35; (R1) 210.51; More...
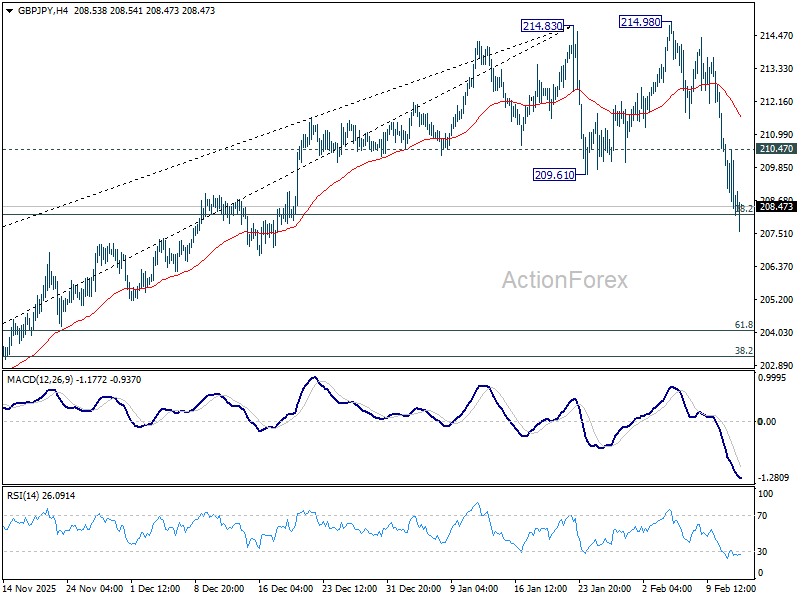
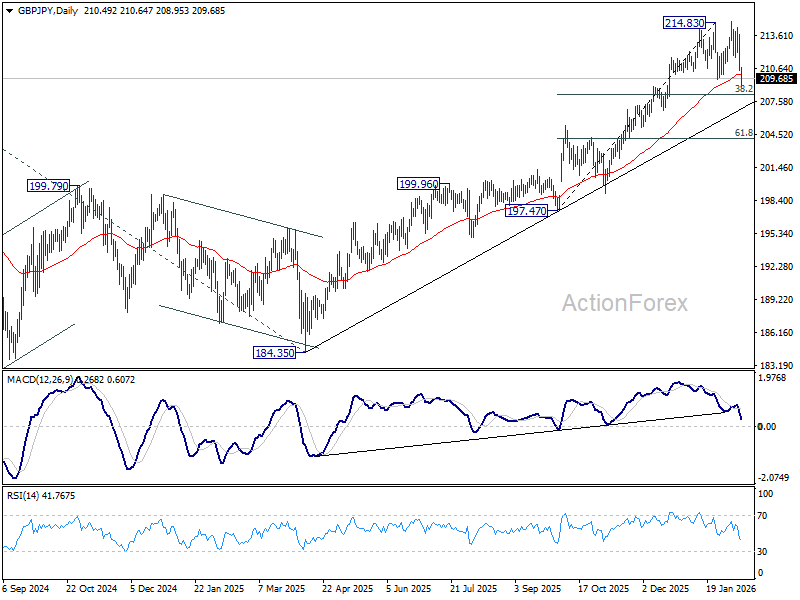
GBP/JPY's fall from 214.83 accelerated lower and immediate focus is now on 38.2% retracement of 197.47 to 214.83 at 208.19. Sustained break there will argue that it's already correcting whole up trend from 184.35. However, strong rebound from current level, followed by break of 210.47 minor resistance will retain near term bullishness, and bring retest of 214.83/98 resistance zone.
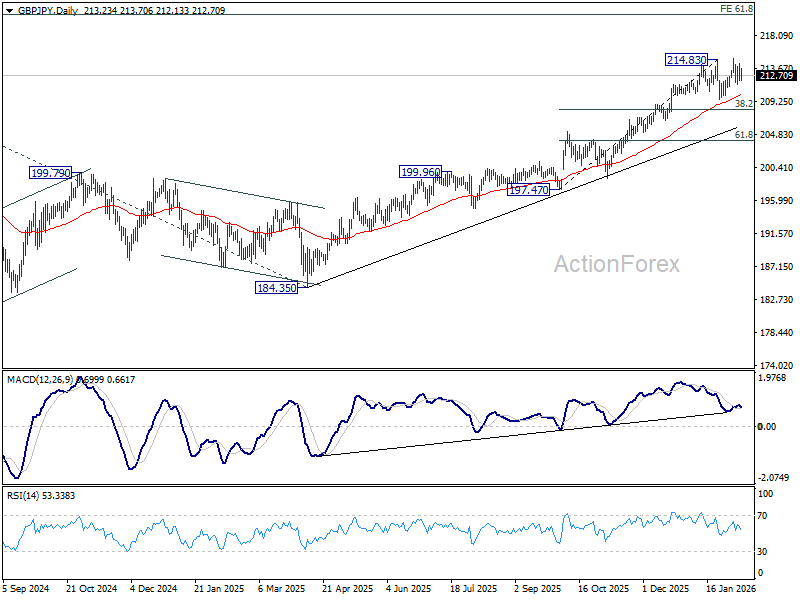
In the bigger picture, up trend from 123.94 (2020 low) is in progress. Next target is 61.8% projection of 148.93 (2022 low) to 208.09 (2024 high) from 184.35 at 220.90. On the downside, break of 205.30 resistance turned support is needed to indicate medium term topping. Otherwise, outlook will stay bullish even in case of deep pullback.
GBP/JPY Daily Outlook
Daily Pivots: (S1) 209.48; (P) 211.61; (R1) 212.73; More...
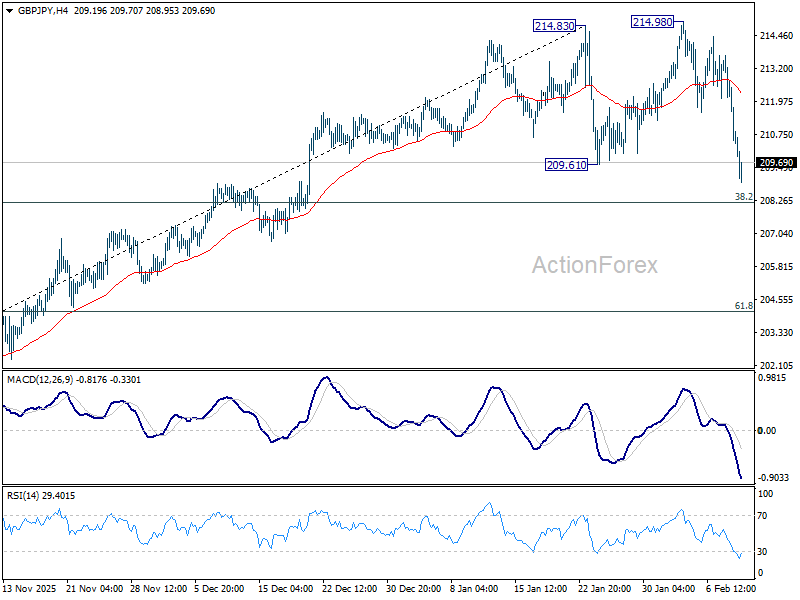
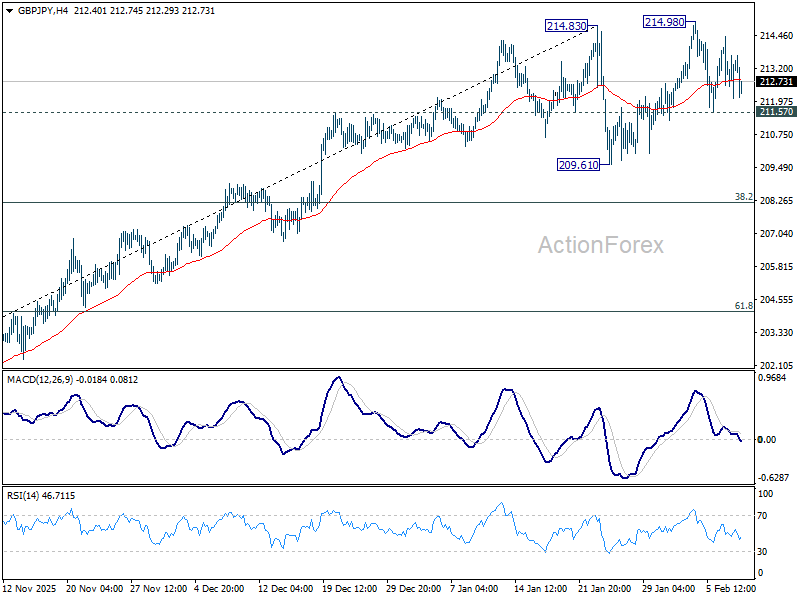
GBP/JPY accelerates lower and breached 209.61 support. But overall price actions from 214.83 are still seen as a consolidation pattern. Downside should be contained by 38.2% retracement of 197.47 to 214.83 at 208.19 to bring rebound. Break of 214.83/98 is expected at a later stage to resume larger up trend. However, firm break of 208.19 will argue that larger scale correction has already started.
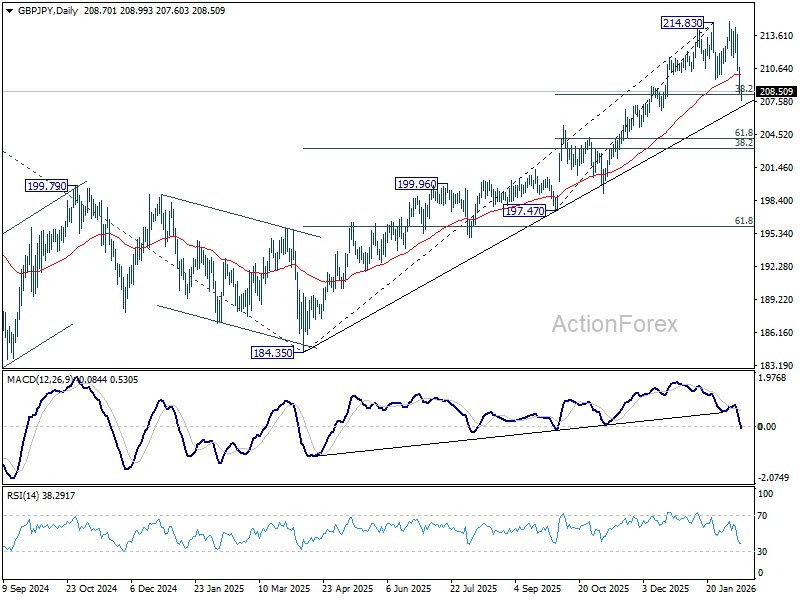
In the bigger picture, up trend from 123.94 (2020 low) is in progress. Next target is 61.8% projection of 148.93 (2022 low) to 208.09 (2024 high) from 184.35 at 220.90. On the downside, break of 205.30 resistance turned support is needed to indicate medium term topping. Otherwise, outlook will stay bullish even in case of deep pullback.
GBP/JPY Daily Outlook
Daily Pivots: (S1) 212.26; (P) 213.37; (R1) 214.60; More...
Intraday bias in GBP/JPY remains neutral for the moment. Below 211.57 minor support will extend the corrective pattern from 214.83 with another downleg, towards 209.61 and below. But downside 38.2% retracement of 197.47 to 214.83 at 208.19 to bring rebound. Meanwhile, firm break of 214.83/98 will extend larger up trend to 220.90 projection level next.
In the bigger picture, up trend from 123.94 (2020 low) is in progress. Next target is 61.8% projection of 148.93 (2022 low) to 208.09 (2024 high) from 184.35 at 220.90. On the downside, break of 205.30 resistance turned support is needed to indicate medium term topping. Otherwise, outlook will stay bullish even in case of deep pullback.