AUD/USD Daily Outlook

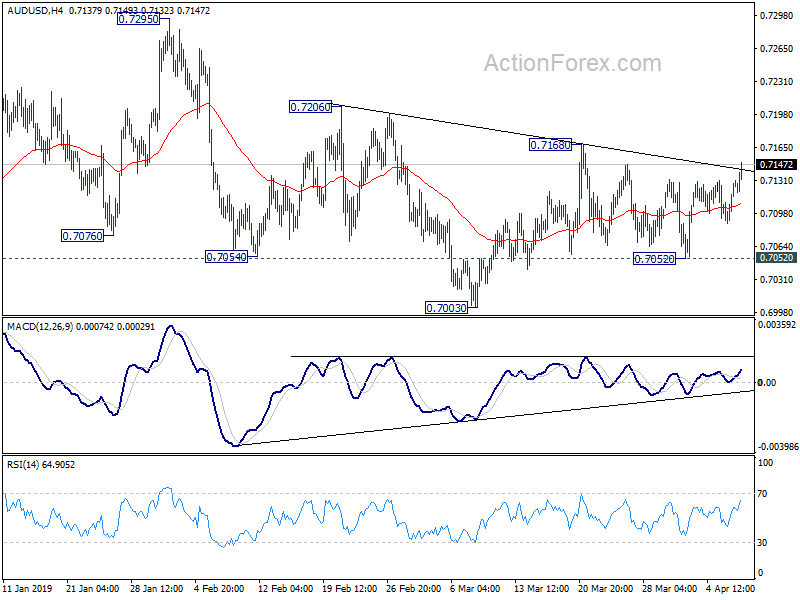
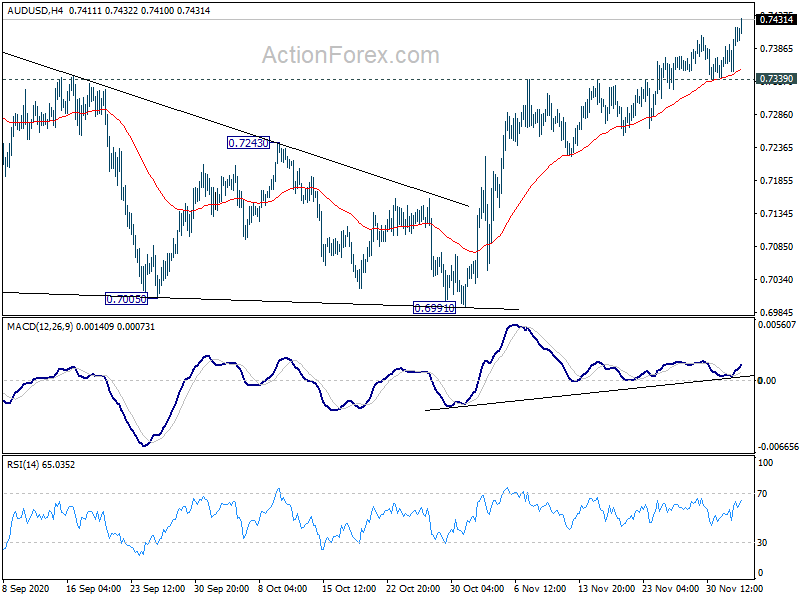
Daily Pivots: (S1) 0.7297; (P) 0.7353; (R1) 0.7397; More…

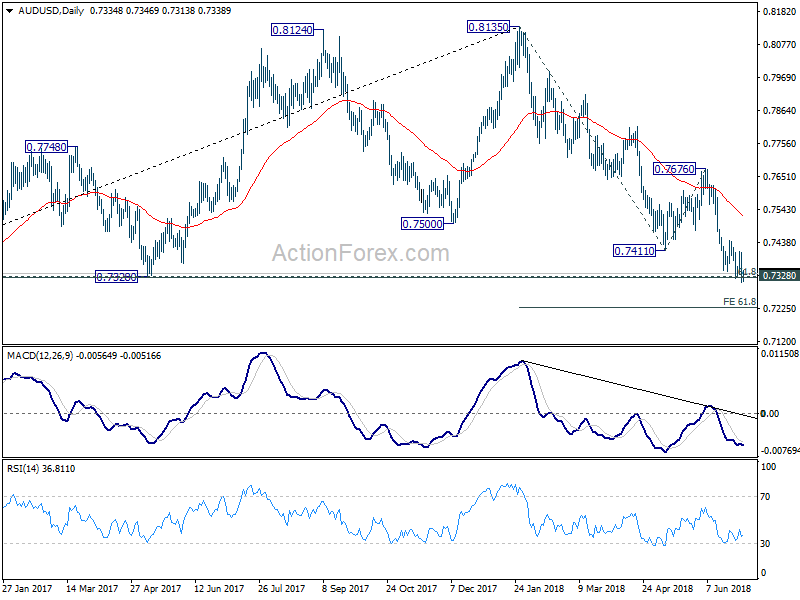
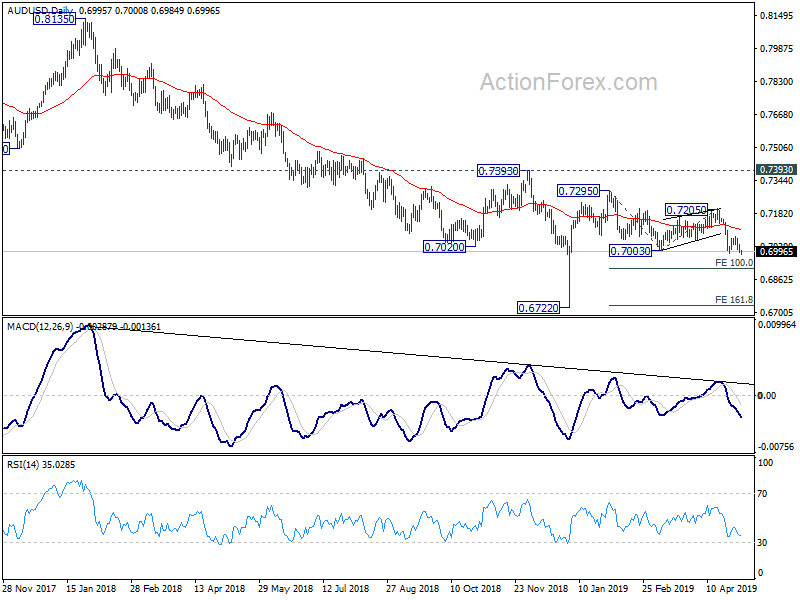
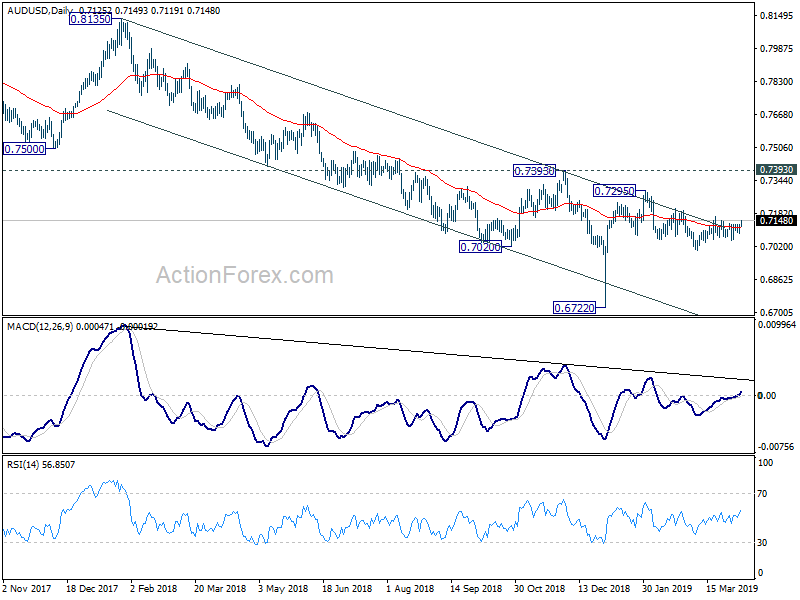
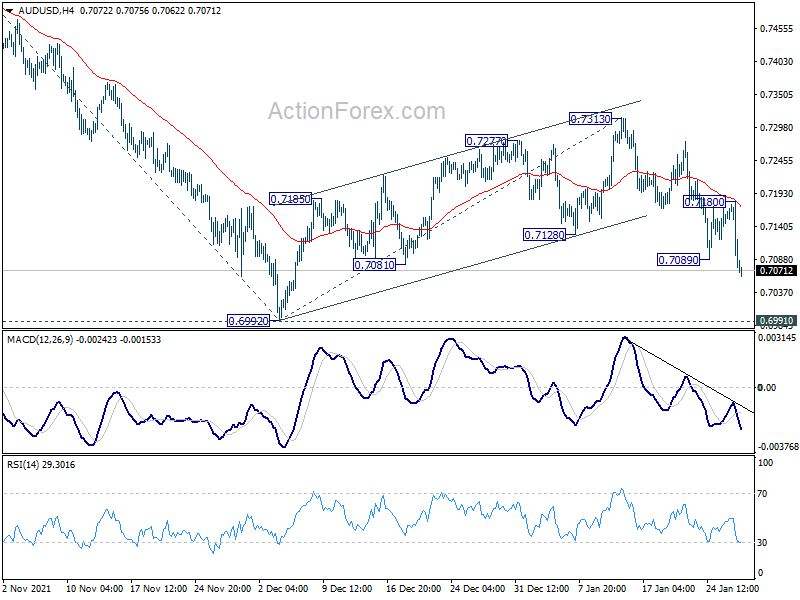
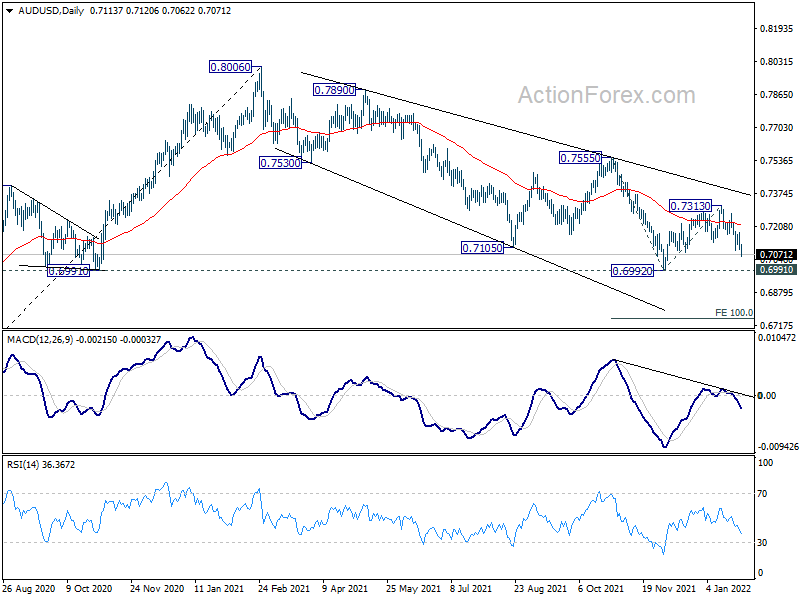
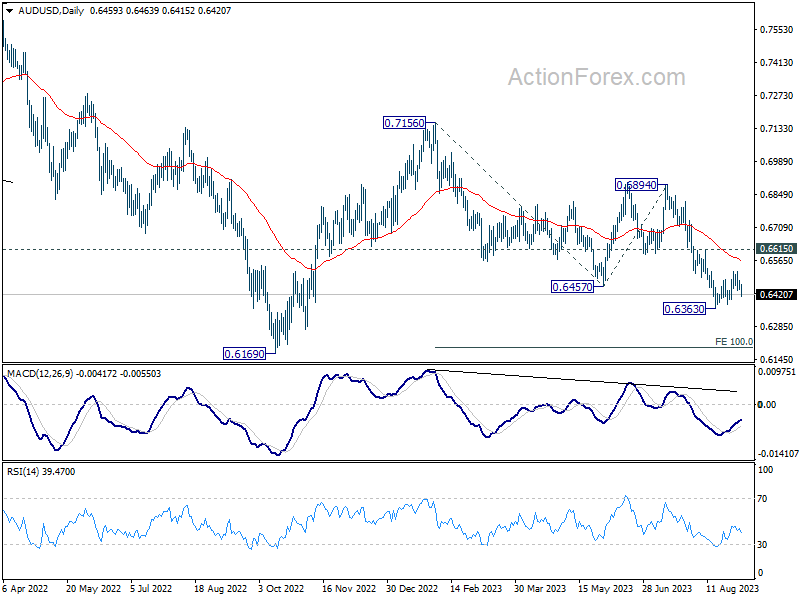
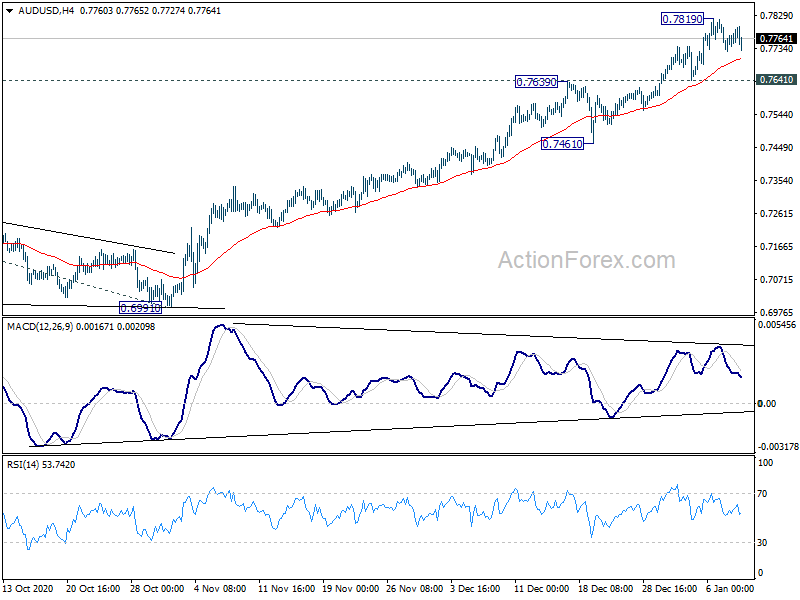
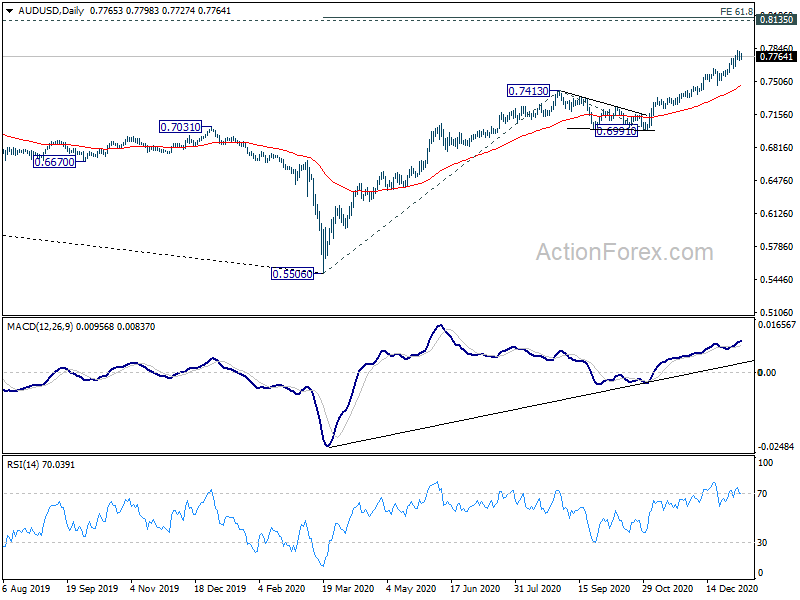
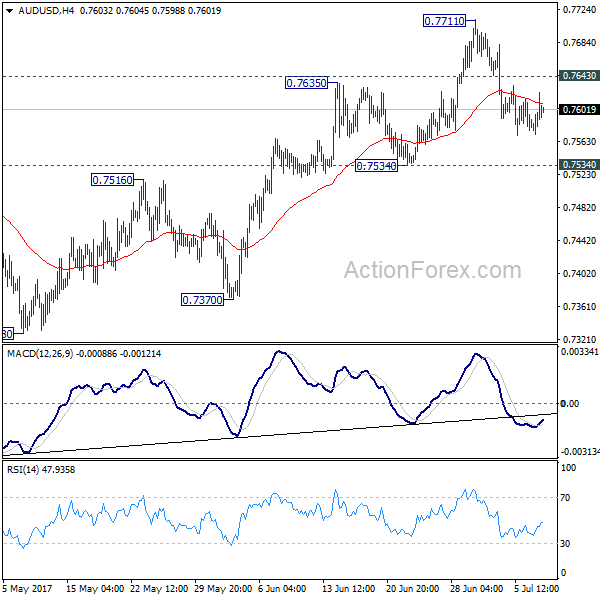
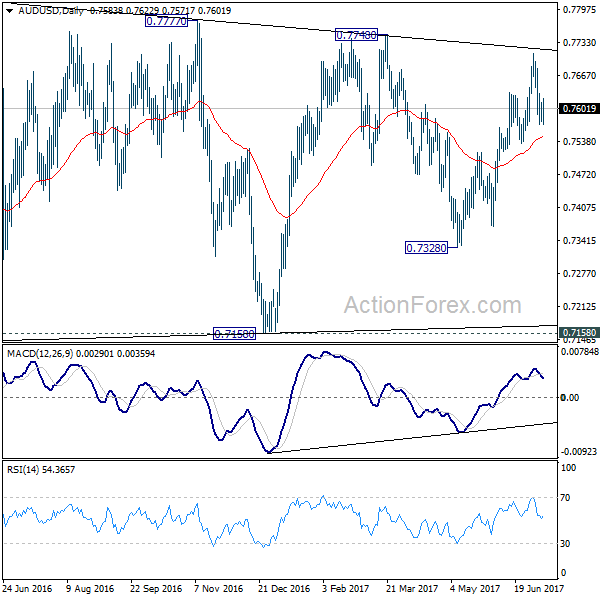
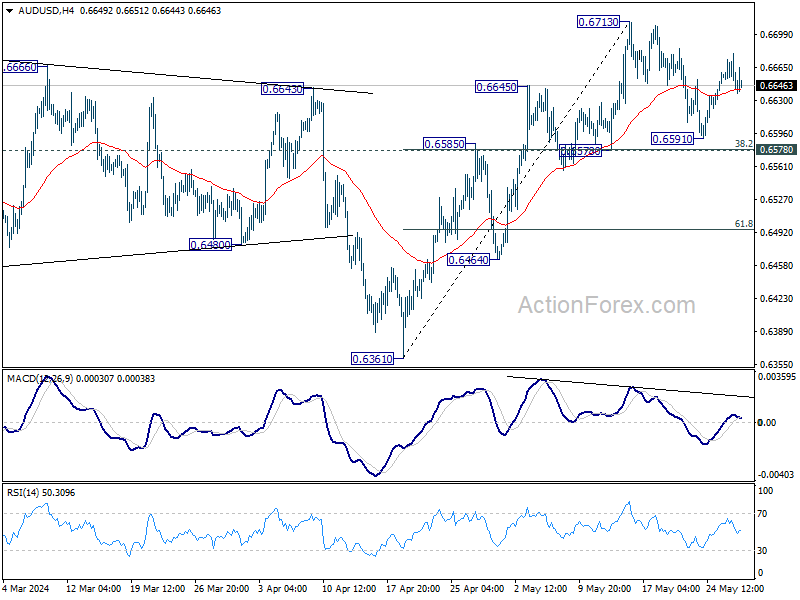
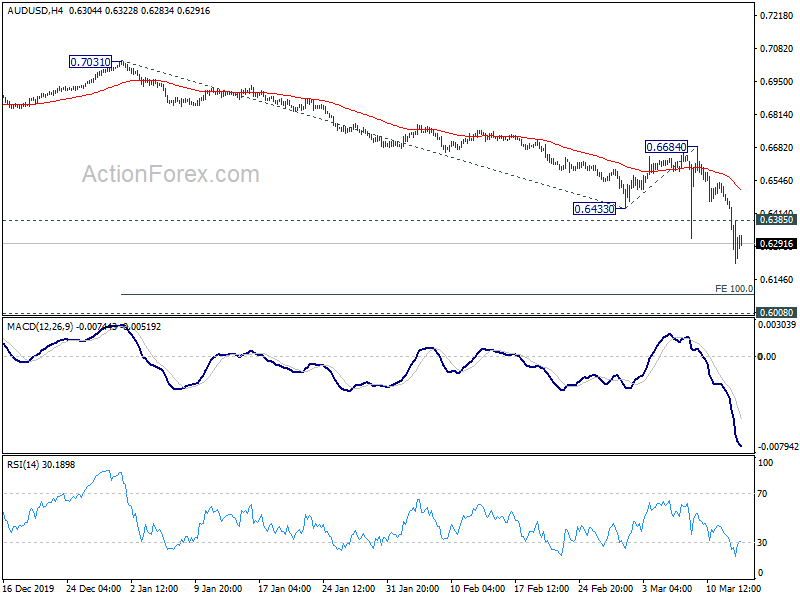
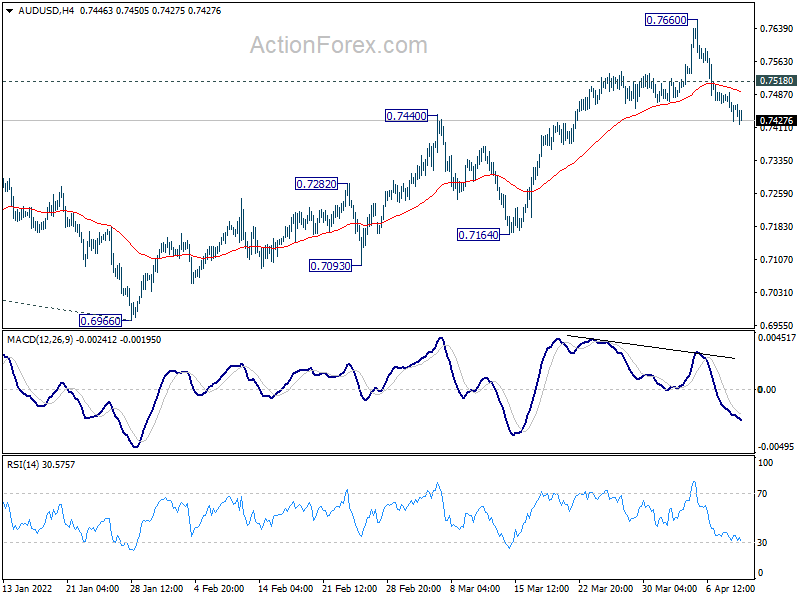
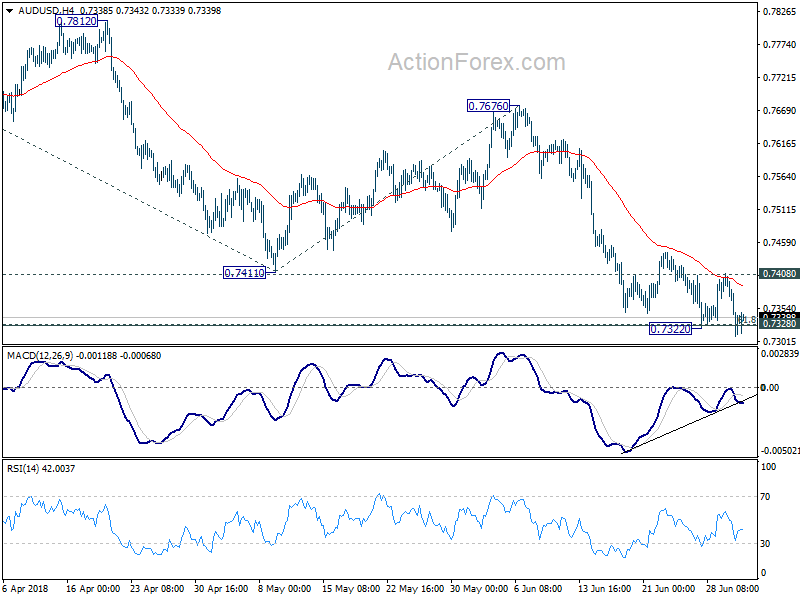
AUD/USD’s fall resumed after brief consolidation and edged lower to 0.7309. Intraday bias is back on the downside. Sustained break of f 0.7328 cluster support (61.8% retracement of 0.6826 to 0.8135 at 0.7326) will target 61.8% projection of 0.8135 to 0.7411 from 0.7676 at 0.7229 next. On the upside, however, break of 0.7408 resistance will indicate short term bottoming and bring stronger rebound back towards 0.7676 resistance.

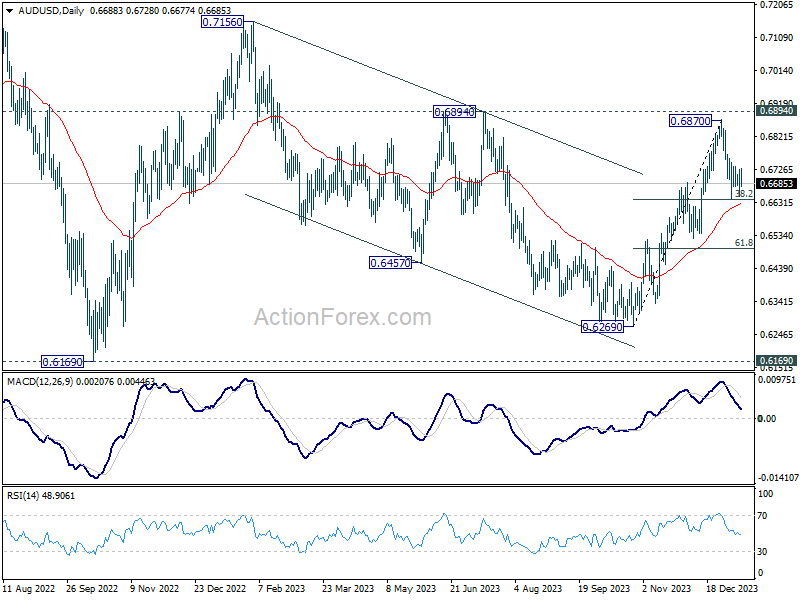
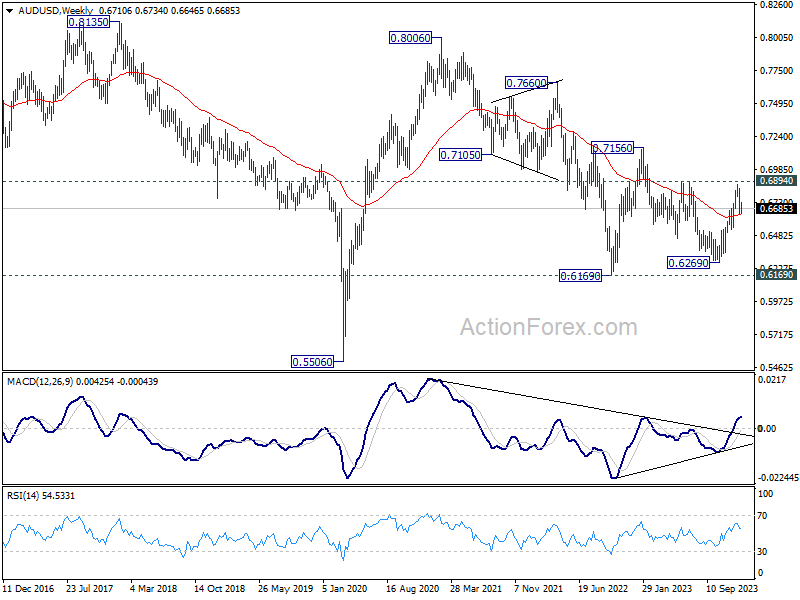
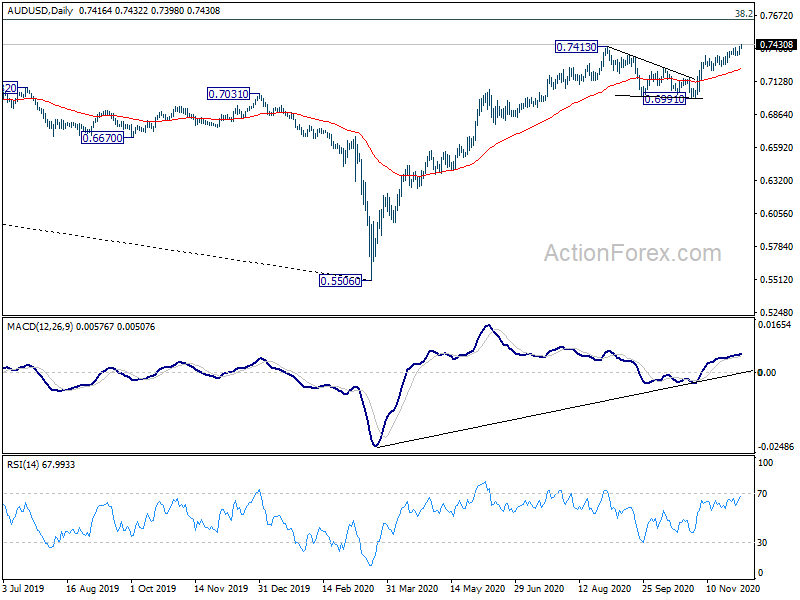
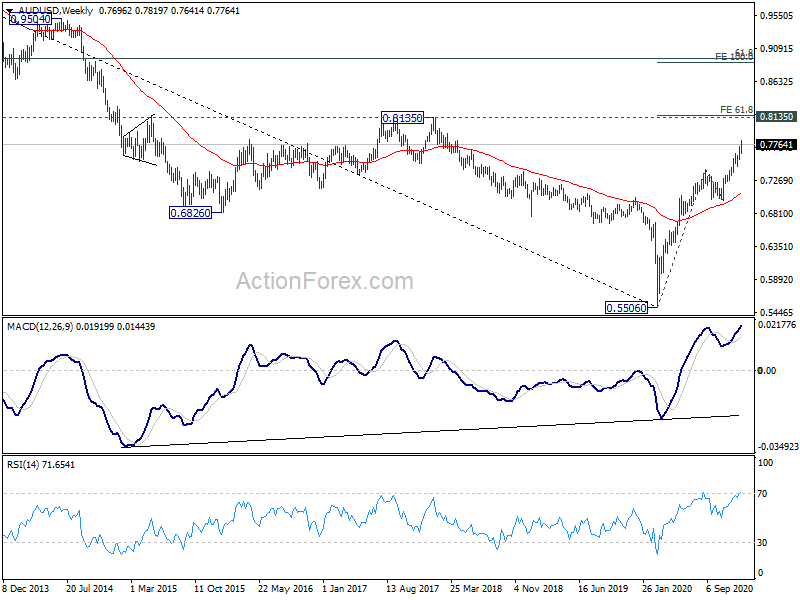
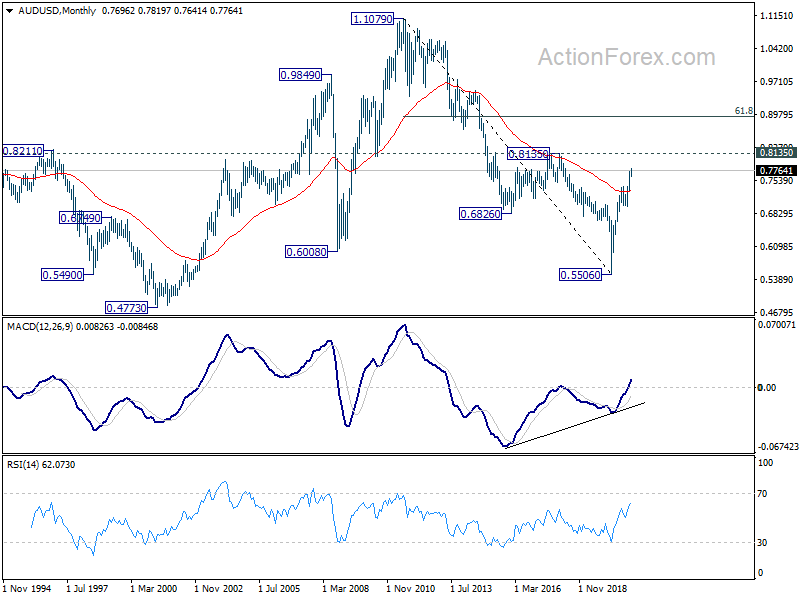
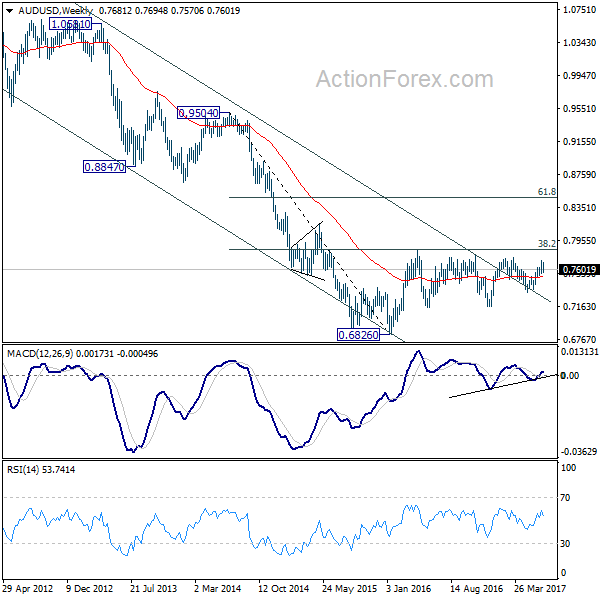
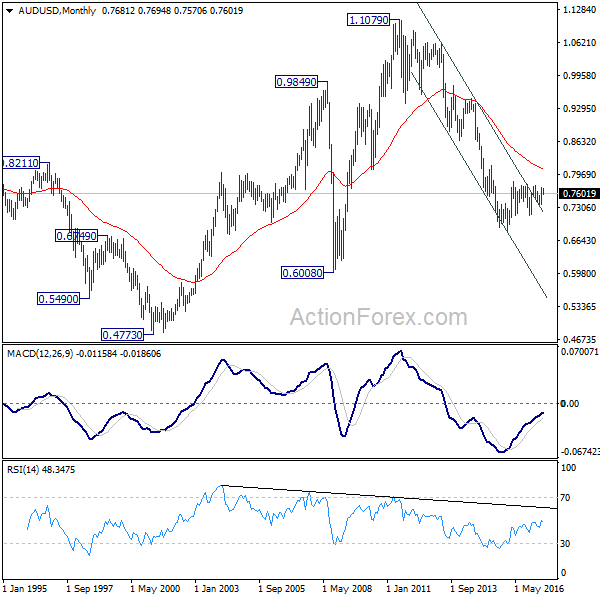
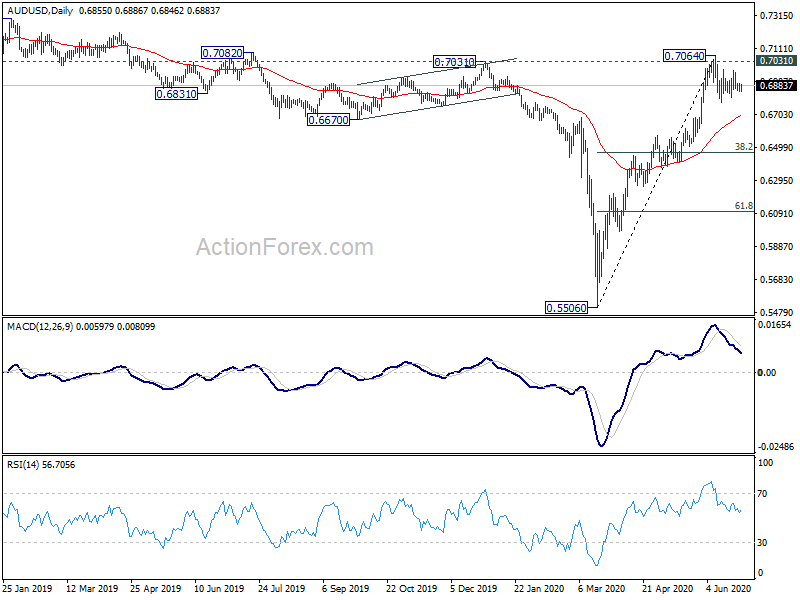
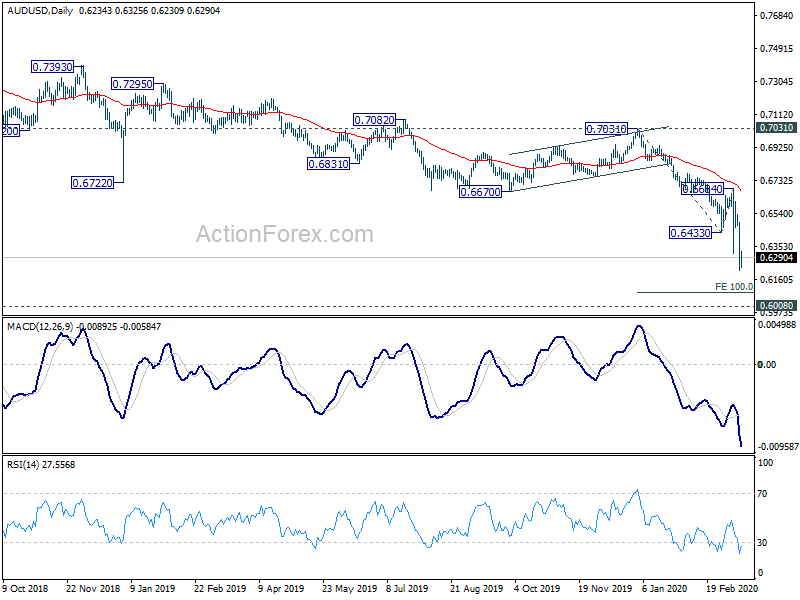
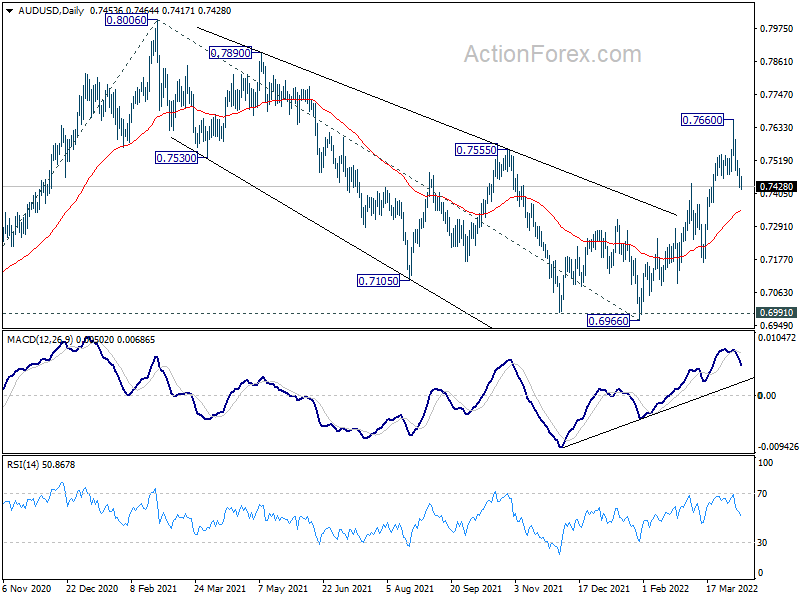
In the bigger picture, medium term rebound from 0.6826 is seen as a corrective move that should be completed at 0.8135. Deeper decline would be seen back to retest 0.6826 low. This will now remain the favored case as long as 0.7676 resistance holds.

AUD/USD Daily Outlook

Daily Pivots: (S1) 0.7812; (P) 0.7834; (R1) 0.7852; More…

As noted before, considering bearish divergence condition in daily MACD, firm break of 0.7807 support will indicate near term reversal. Outlook will then be turned bearish for 55 week EMA (now at 0.7674) first. Meanwhile, rebound from 0.7807 will retain bullishness. Above 0.7907 minor resistance will turn bias back to the upside for retesting 0.8124 high.

In the bigger picture, rise from 0.6826 medium term bottom is seen as corrective pattern. In case of further rally, strong resistance should be seen at 38.2% retracement of 1.1079 to 0.6826 at 0.8451 to limit upside. Meanwhile, firm break of 0.7807 is the first signal that such correction is focused. Break of 0.7328 will bring retest of 0.6826 low.

AUD/USD 4 Hours Chart

AUD/USD Daily Chart

AUD/USD Daily Outlook

Daily Pivots: (S1) 0.6987; (P) 0.7008; (R1) 0.7022; More…

AUD/USD drops to as low as 0.6984 so far today. Breach of 0.6988 temporary low suggests resumption of fall from 0.7295. Intraday bias is back on the downside for 100% projection of 0.7295 to 0.7003 from 0.7205 at 0.6913. Decisive break there will indicate further downside acceleration. On the upside, break of 0.7069 resistance is needed to indicate short term bottoming. Otherwise, outlook will remain bearish in case of recovery.

In the bigger picture, with 0.7393 key resistance intact, medium term outlook remains bearish. The decline from 0.8135 (2018 high) is seen as resuming long term down trend from 1.1079 (2011 high). Decisive break of 0.6826 (2016 low) will confirm this bearish view and resume the down trend to 0.6008 (2008 low). However, firm break of 0.7393 will argue that fall from 0.8135 has completed. And corrective pattern from 0.6826 has started the third leg, targeting 0.8135 again.

AUD/USD Daily Outlook

Daily Pivots: (S1) 0.7915; (P) 0.7947; (R1) 0.7994; More…

Intraday bias in AUD/USD remains on the upside as rise from 0.7500 is in progress for 0.8124 high. Break there will resume whole medium term rebound from 0.6826 and target key fibonacci level at 0.8451. On the downside, break of 0.7804 support is needed to indicate short term topping. Otherwise, outlook will remain bullish in case of retreat.

In the bigger picture, current development suggests that medium term rebound from 0.6826 is still in progress and could be resuming. Such rise could target 38.2% retracement of 1.1079 (2011 high) to 0.6826 (2016 low) at 0.8451. As such rise is seen as a corrective move, we’d expect strong resistance from 0.8451 to limit upside.

AUD/USD 4 Hours Chart

AUD/USD Daily Chart

AUD/USD Weekly Report

AUD/USD turned into sideway trading above 0.6639 last week. Initial bias remains neutral this week and further decline is expected as long as 0.6759 minor resistance holds. Firm break of 0.6639 will resume the fall from 0.6870 to 61.8% retracement of 0.6269 to 0.6870 at 0.6497 next. On the upside, break of 0.6759 will bring retest of 0.6870 resistance instead.

In the bigger picture, price actions from 0.6169 (2022 low) could be just a medium term corrective pattern to the down trend from 0.8006 (2021 high). Rise from 0.6269 is seen as the third leg of the pattern that could target 0.7156 on break of 0.6894 resistance. For now, range trading should be seen between 0.6169 and 0.7156 (2023 high), until further developments.

In the long term picture, the down trend from 1.1079 (2011 high) should have completed at 0.5506 (2020 low) already. It’s unsure yet whether price actions from 0.5506 are developing into a corrective pattern, or trend reversal. But in either case, fall from 0.8006 is seen the second leg of the pattern. Hence, in case of deeper decline, downside strong support should emerge above 0.5506 to bring reversal.

AUD/USD Daily Outlook

Daily Pivots: (S1) 0.7099; (P) 0.7115; (R1) 0.7144; More…

AUD/USD’s rebound from 0.7052 extends higher today and focus is back on 0.7168 resistance. Decisive break there will suggest that the corrective decline from 0.7295 has completed at 0.7003 already. Intraday bias will be turned to the upside to resume the rebound from 0.6722 through 0.7295. On the downside, though, sustained break of 0.7052 will target 0.7004 first. Break will resume the fall from 0.7295 instead.

In the bigger picture, as long as 0.7393 resistance holds, fall from 0.8135 is still expected to extend. Such decline is seen as resuming long term down trend from 1.1079 (2011 high). Decisive break of 0.6826 (2016 low) will confirm this bearish view and resume the down trend to 0.6008 (2008 low). However, firm break of 0.7393 will argue that fall from 0.8135 has completed. And corrective pattern from 0.6826 has started the third leg, targeting 0.8135 again.

AUD/USD Daily Report

Daily Pivots: (S1) 0.6591; (P) 0.6626; (R1) 0.6646; More…

Intraday bias in AUD/USD is back on the downside with break of 0.6604 temporary lo, to 0.6563. Decisive break there will resume larger decline from 0.7156 to 61.8% projection of 0.7156 to 0.6563 from 0.6817 at 0.6451. On the upside, above 0.6674 minor resistance will delay the bearish case, and extend the corrective pattern from 0.6563 with another rising leg.

In the bigger picture, the failure to break through 55 W EMA (now at 0.6822) keeps medium term outlook bearish. Firm break of 61.8% retracement of 0.6169 to 0.7156 at 0.6546 will raise the chance of long term down trend resumption through 0.6169 low. This will now be the favored case as long as 0.6817 resistance holds.

AUD/USD Daily Report

Daily Pivots: (S1) 0.7371; (P) 0.7396; (R1) 0.7439; More…

AUD/USD’s break of 0.7413 suggests resumption of rise from 0.5506. Intraday bias is back on the upside. Next target is 0.7635 long term fibonacci level. On the downside, below 0.7339 minor support will turn intraday bias neutral and bring consolidations first.

In the bigger picture, the sustained trading above 55 week EMA (now at 0.6993) is a sign of medium term bullishness. Nevertheless, AUD/USD will still need to overcome 38.2% retracement of 1.1079 (2011 high) to 0.5506 (2020 low) at 0.7635 decisively to indicate completion of long term down trend from 1.1079. Otherwise, current rebound from 0.5506 could still turn out to be a correction in the long term down trend.

AUD/USD Daily Outlook

Daily Pivots: (S1) 0.7994; (P) 0.8031; (R1) 0.8074; More…

As noted before, a short term top was formed at 0.8135 after failing to sustain above 0.8124 resistance. Intraday bias remains on the downside for 55 day EMA (now at 0.7856). At this point, we’d expect strong support from there to bring rebound. But sustained trading below the EMA will bring retest of 0.7500 key near term support. On the upside, sustained break of 0.8124 will resume whole medium term rebound from 0.6826 and target key fibonacci level at 0.8451.

In the bigger picture, current development suggests that medium term rebound from 0.6826 is still in progress and could be resuming. Such rise could target 38.2% retracement of 1.1079 (2011 high) to 0.6826 (2016 low) at 0.8451. As such rise is seen as a corrective move, we’d expect strong resistance from 0.8451 to limit upside and bring reversal. Break of 0.7500 support will indicate that the medium term trend has reversed.

AUD/USD 4 Hours Chart

AUD/USD Daily Chart

AUD/USD Daily Report

Daily Pivots: (S1) 0.7081; (P) 0.7131; (R1) 0.7166; More…

AUD/USD’s fall from 0.7313 resumes after brief recovery and intraday bias is back on the downside for retesting 0.6991/2 support zone. Further break there will resume larger down trend from 0.8006, and carries larger bearish implication. Next target will be 100% projection of 0.7555 to 0.6992 from 0.7313 at 0.6750. On the upside, break of 0.7180 minor resistance will mix up the near term outlook and turn intraday bias neutral first.

In the bigger picture, strong rebound from 0.6991 key structural support will retain medium term bullishness. That is, whole up trend from 0.5506 is still in progress. Firm break of 0.7555 resistance will target 0.8006 high and above. However, sustained break of 0.6991 will argue that the whole up trend from 0.5506 might be finished at 0.8006, after rejection by 0.8135 long term resistance. Deeper decline would then be seen back to 61.8% retracement of 0.5506 to 0.8006 at 0.6461.

AUD/USD Daily Outlook

Daily Pivots: (S1) 0.7461; (P) 0.7484; (R1) 0.7526; More…

Intraday bias in AUD/USD remains neutral for the momentum as it’s staying below 0.7516 temporary top. With 0.7555 resistance intact, fall from 0.7748 is still expected to continue. Below 0.7405 minor support will turn bias to the downside for 0.7382. Break there will target 0.7144/7158 support zone. However, firm break of 0.7555 will argue that fall from 0.7748 is completed and turn bias back to the upside.

In the bigger picture, we’re still treating price actions from 0.6826 low as a corrective pattern. And, as long as 38.2% retracement of 0.9504 to 0.6826 at 0.7849 holds, long term down trend from 1.1079 is expected to resume sooner or later. Break of 0.6826 low will target 0.6008 key support level. However, firm break of 0.7849 will indicate that rise from 0.6826 is developing into a medium term rebound, rather than a sideway pattern. In such case, stronger rise should be seen to 55 month EMA (now at 0.8115) and above.

AUD/USD 4 Hours Chart

AUD/USD Daily Chart

AUD/USD Daily Report

Daily Pivots: (S1) 0.6336; (P) 0.6390; (R1) 0.6419; More…

AUD/USD’s breach of 0.6330 support indicates resumption of recent down trend. Intraday bias is back on the downside. Current fall from 0.7156 should target 100% projection of 0.7156 to 0.6457 from 0.6894 at 0.6195. On the upside, break of 0.6500 resistance is needed to indicate short term bottoming. Otherwise, outlook will stay bearish in case of recovery.

In the bigger picture, down trend from 0.8006 (2021 high) is possibly still in progress. Decisive break of 0.6169 will target 61.8% projection of 0.8006 to 0.6169 to 0.7156 at 0.6021. This will now remain the favored case as long as 0.6894, in case of strong rebound.

AUD/USD Daily Report

Daily Pivots: (S1) 0.6444; (P) 0.6463; (R1) 0.6480; More…

AUD/USD falls notably today but stays above 0.6363 short term bottom. Intraday bias remains neutral for now, and another recovery cannot be ruled out. But in that case, upside should be limited by 0.6615 resistance. On the downside, firm break of 0.6363 will resume larger fall from 0.7156 to 100% projection of 0.7156 to 0.6457 from 0.6894 at 0.6195.

In the bigger picture, current development argues that the down trend from 0.8006 (2021 high) is still in progress. Decisive break of 0.6169 will target 61.8% projection of 0.8006 to 0.6169 to 0.7156 at 0.6021. This will now remain the favored case as long as 0.6894, in case of strong rebound.

AUD/USD Weekly Outlook

AUD/USD’s up trend continued last week and reached as high as 0.7819. As a temporary top was formed, initial bias is neutral this week for consolidations first. But outlook stays bullish as long as 0.7641 support holds. Break of 0.7819 will target 61.8% projection of 0.5506 to 0.7413 from 0.6991 at 0.8170. However, break of 0.7641 will indicate short term topping, on bearish divergence condition in 4 hour MACD. Intraday bias will be turned back to the downside for deeper correction.

In the bigger picture, whole down trend from 1.1079 (2001 high) should have completed at 0.5506 (2020 low) already. Rise from 0.5506 could either the start of a long term up trend, or a corrective rise. Reactions to 0.8135 key resistance will reveal which case it is.

In the longer term picture, 0.5506 is a long term bottom, on bullish convergence condition in monthly MACD. Focus is now back on 0.8135 structure resistance. Decisive break there will rise the chance that rise from 0.5506 is an impulsive up trend. Next target should be 61.8% retracement at 0.8950 and above. Though, rejection by 0.8135 will keep the case of medium to long term sideway consolidation open.

AUD/USD Weekly Outlook

AUD/USD’s corrective move from 0.7711 continued last week and outlook is unchanged. Initial bias remains neutral this week first. With 0.7534 support intact, another rise is in favor. Above 0.7643 minor resistance will bring retest of 0.7711. Break will extend the rally from 0.7328 to 0.7748 resistance and above. At this point, there is no clear sign of range breakout yet. Hence, we’d be cautious on topping again as it approaches medium term fibonacci level at 0.7849. On the downside, break of 0.7534 will indicate near term reversal and turn bias back to the downside for 0.7370 support.

In the bigger picture, we’re still treating price actions from 0.6826 low as a corrective pattern. And, as long as 38.2% retracement of 0.9504 to 0.6826 at 0.7849 holds, long term down trend from 1.1079 is expected to resume sooner or later. Break of 0.6826 low will target 0.6008 key support level. However, firm break of 0.7849 will indicate that rise from 0.6826 is developing into a medium term rebound, rather than a sideway pattern. In such case, stronger rise should be seen to 55 month EMA (now at 0.8082) and above.

In the longer term picture, while the down trend from 1.1079 might extend lower, we’re not anticipating a break of 0.6008 (2008 low) yet. We’ll look for bottoming above there to reverse the medium term trend.

AUD/USD 4 Hours Chart

AUD/USD Daily Chart

AUD/USD Weekly Chart

AUD/USD Monthly Chart

AUD/USD Daily Report

Daily Pivots: (S1) 0.6635; (P) 0.6657; (R1) 0.6672; More...

Intraday bias in AUD/USD remains neutral as range trading continues below 0.6713. Further rally is in favor with 0.6578 cluster support (38.2% retracement of 0.6361 to 0.6713 at 0.6579) intact. On the upside, firm break of 0.6713 will resume whole rise from 0.6361 to 0.6870 resistance next. However, sustained break of 0.6578 will dampen this bullish view, and bring deeper fall to 61.8% retracement at 0.6495.

In the bigger picture, price actions from 0.6169 (2022 low) are seen as a medium term corrective pattern to the down trend from 0.8006 (2021 high). Fall from 0.7156 (2023 high) is seen as the second leg, which could have completed at 0.6269 already. Rise from there is seen as the third leg which is now trying to resume through 0.6870 resistance.

AUD/USD Weekly Outlook

AUD/USD’s decline from 0.8124 resumed last week and reached as low as 0.7500. Initial bias remains on the downside this week. AUD/USD should target 0.7322/8 cluster support next. On the upside, break of 0.7652 resistance is needed to indicate short term bottoming. Otherwise, outlook will remain bearish in case of recovery.

In the bigger picture, corrective rise from 0.6826 medium term bottom is likely completed at 0.8124, after hitting 55 month EMA (now at 0.8029). Decisive break of 0.7328 key cluster support (61.8% retracement 0.6826 to 0.8124 at 0.7322) will confirm. And in that case, long term down trend from 1.1079 (2011 high) will likely be resuming. Break of 0.6826 will target 61.8% projection of 1.1079 to 0.6826 from 0.8124 at 0.5496. This will now be the favored case as long as 0.7732 near term resistance holds.

In the longer term picture, 0.6826 is seen as a long term bottom. Rise from there could either reverse the down trend from 1.1079, or just develop into a corrective pattern. At this point, we’re favoring the latter. And, as long as 38.2% retracement of 1.1079 to 0.6826 at 0.8451 holds, we’d anticipate another decline through 0.6826 at a later stage. But strong support should be seen between 0.4773 (2001 low) and 0.6008 (2008 low).

AUD/USD 4 Hours Chart

AUD/USD Daily Chart

AUD/USD Weekly Chart

AUD/USD Monthly Chart

AUD/USD Daily Report

Daily Pivots: (S1) 0.6836; (P) 0.6866; (R1) 0.6891; More…

Intraday bias in AUD/USD stays neutral first. The correction from 0.7064 is expected to extend with at least one more down leg. On the downside, break of 0.6776 will turn bias to the downside for 38.2% retracement of 0.5506 to 0.7064 at 0.6469. Nevertheless, sustained break of 0.7064 will resume whole rise from 0.5506 instead.

In the bigger picture, rebound from 0.5506 medium term bottom could be correcting whole long term down trend from 1.1079 (2011 high). Further rally would be seen to 55 month EMA (now at 0.7323). This will remain the preferred case as long as it stays above 55 week EMA (now at 0.6721). Sustained trading below 55 week EMA will turn focus back to 0.5506 low instead.

AUD/USD Daily Report

Daily Pivots: (S1) 0.6136; (P) 0.6314; (R1) 0.6415; More…

Intraday bias in AUD/USD remains on the downside at this point. Current down trend should target 100% projection of 0.7031 to 0.6433 from 0.6684 at 0.6086 next. On the upside, above 0.6385 minor resistance will turn intraday bias neutral first. But recovery should be limited below 0.6684 resistance to bring fall resumption.

In the bigger picture, AUD/USD’s decline from 0.8135 (2018 high) is still in progress. It’s part of the larger down trend from 1.1079 (2011 high). Rejection by 55 week EMA affirms medium term bearishness. Next target is 0.6008 (2008 low). Outlook will stay bearish as long as 0.7031 resistance holds, even in case of strong rebound.

AUD/USD Daily Report

Daily Pivots: (S1) 0.7427; (P) 0.7460; (R1) 0.7493; More…

Intraday bias in AUD/USD remains on the downside at this point. Pull back from 0.7660 short term top is in progress for 55 day EMA (now at 0.7346). On the upside, above 0.7518 minor resistance will turn bias back to the upside for 0.7660. Firm break there will resume larger rise from 0.6991 to retest 0.8006 high.

In the bigger picture, correction from 0.8006 could have completed at 0.6966, after drawing support from 0.6991. That is, up trend from 0.5506 (2020 low) might be ready to resume. Firm break of 0.8006 will target 61.8% projection of 0.5506 to 0.8006 from 0.6966 at 0.8511 next. This will remain the favored case as long as 0.7164 support holds.