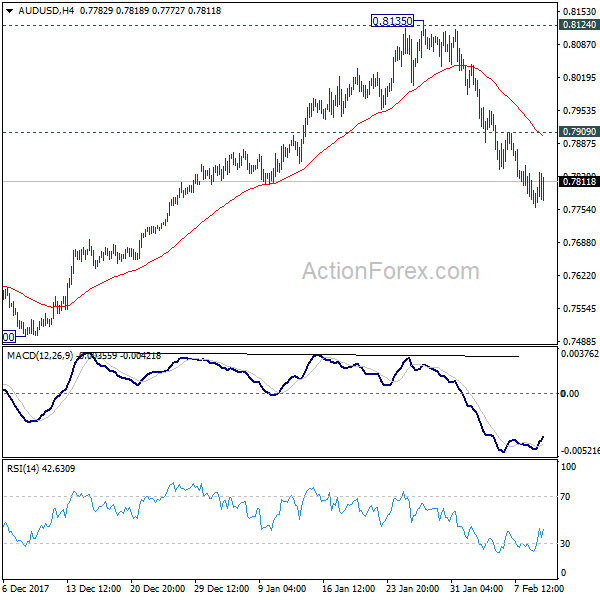
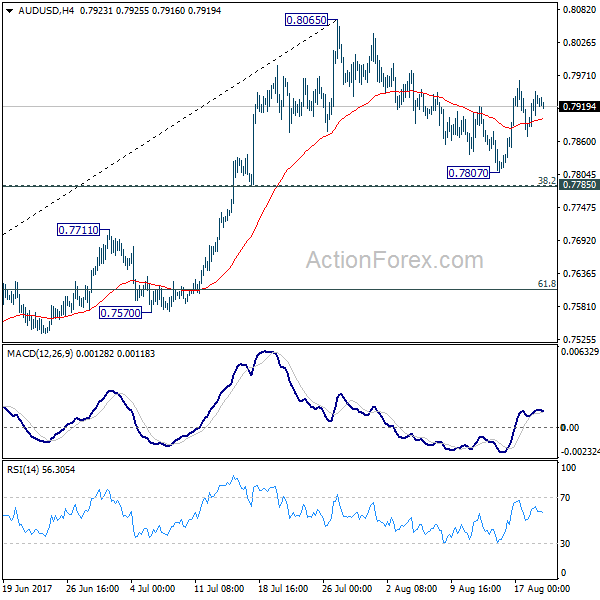
Daily Pivots: (S1) 0.7902; (P) 0.7934; (R1) 0.7977; More…
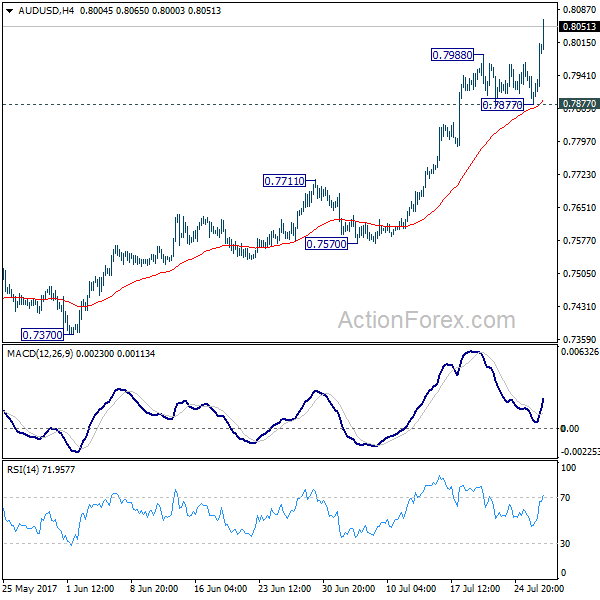
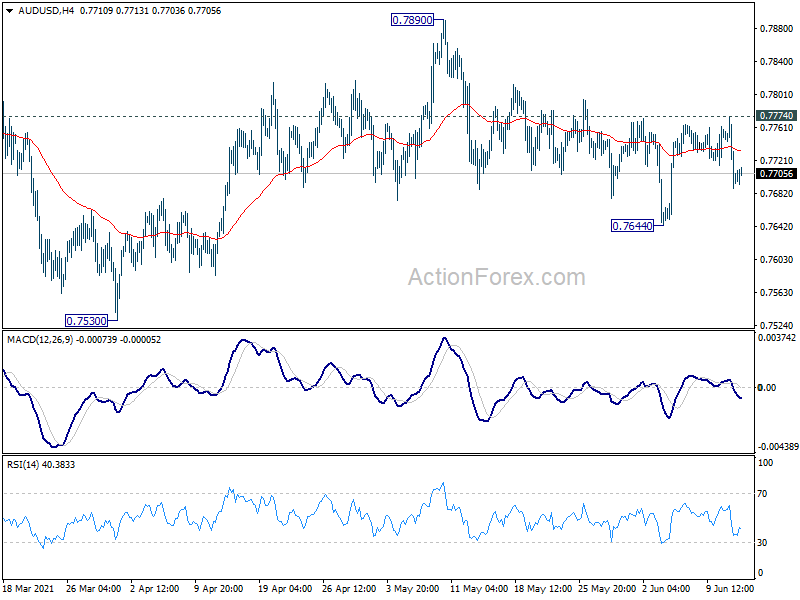
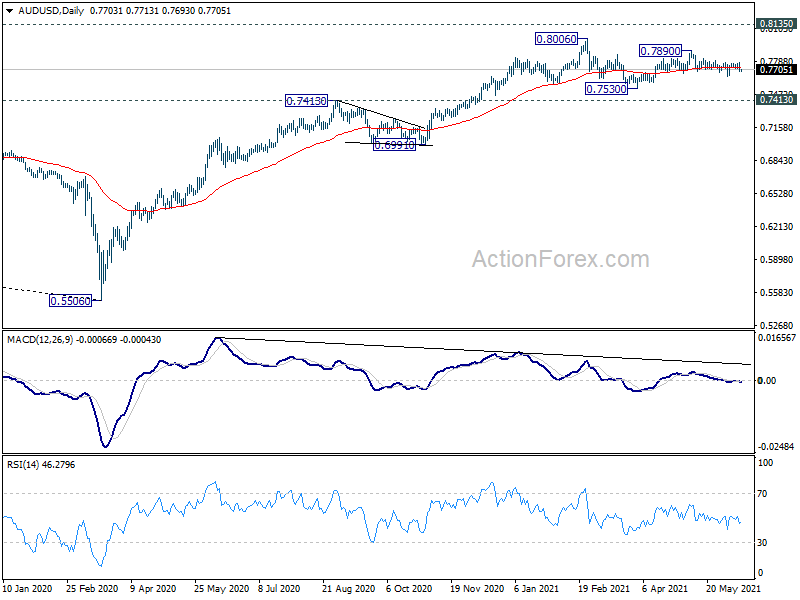
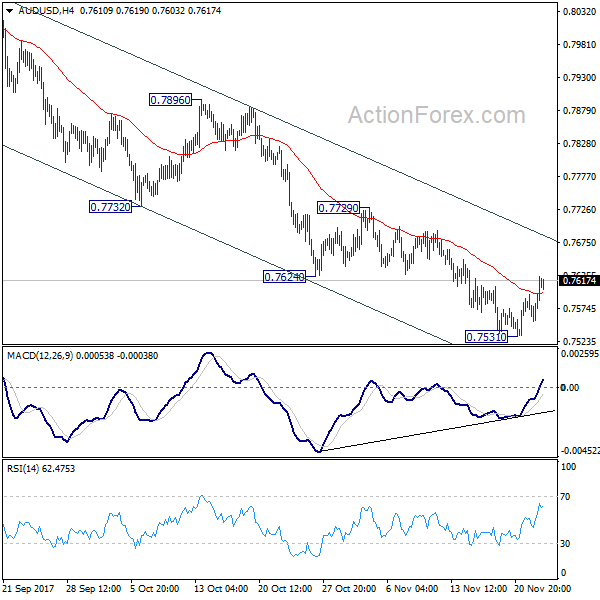
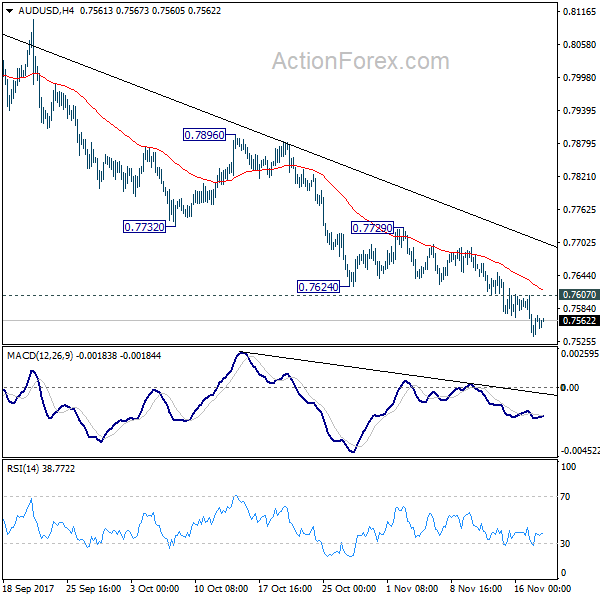
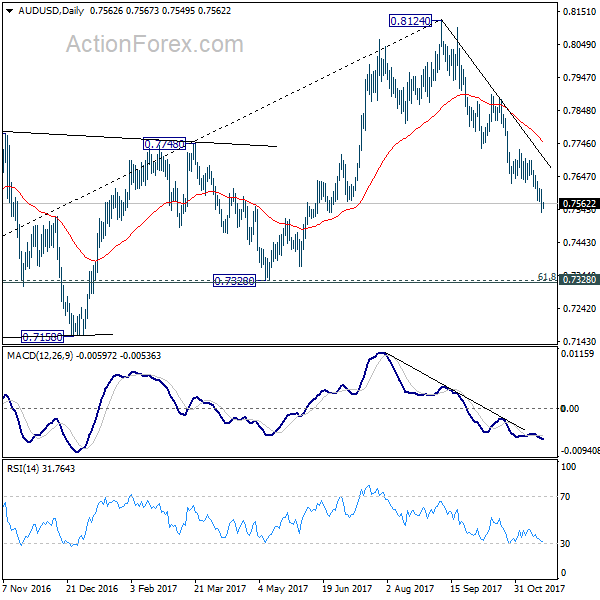
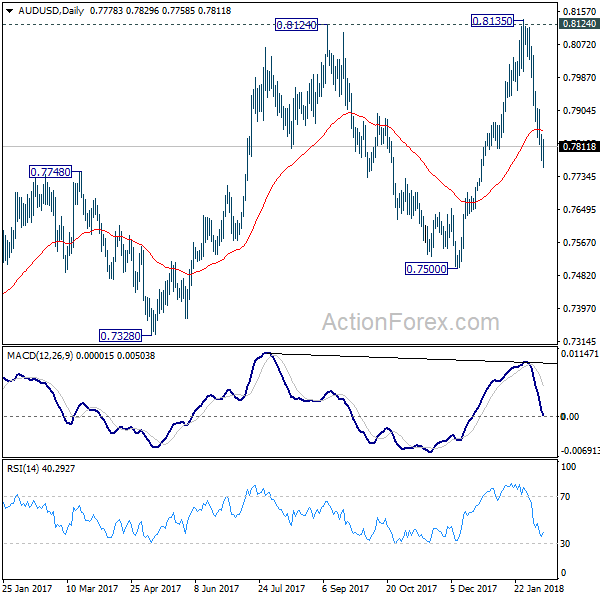
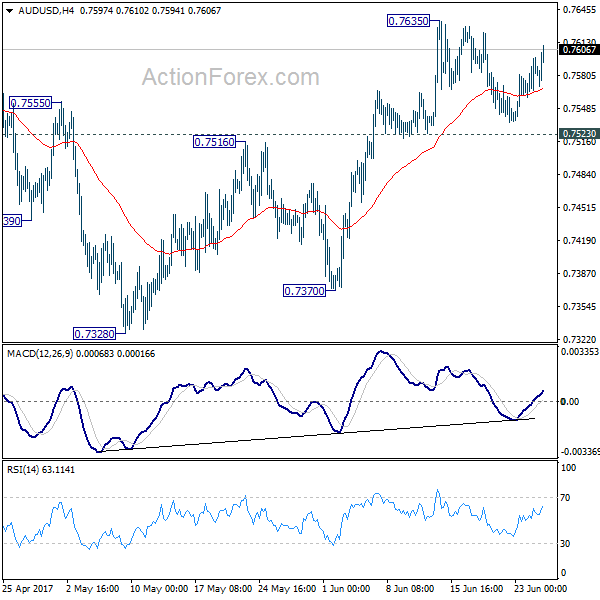
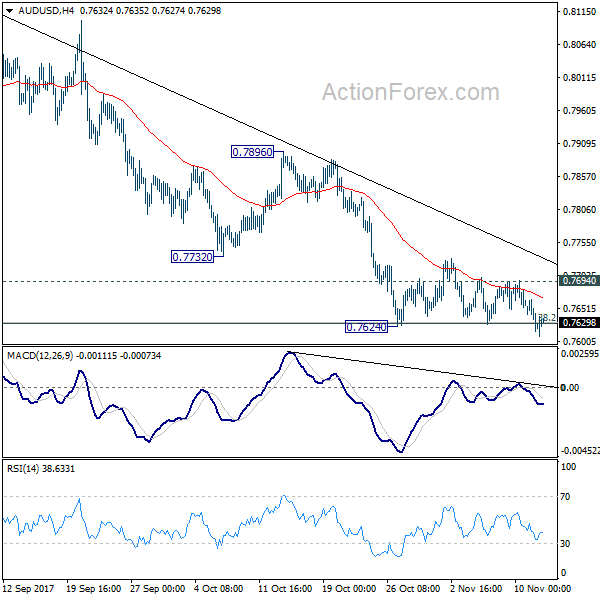
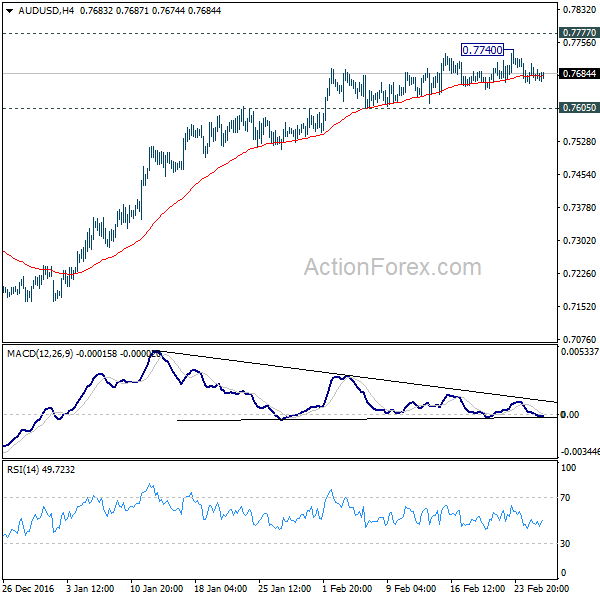
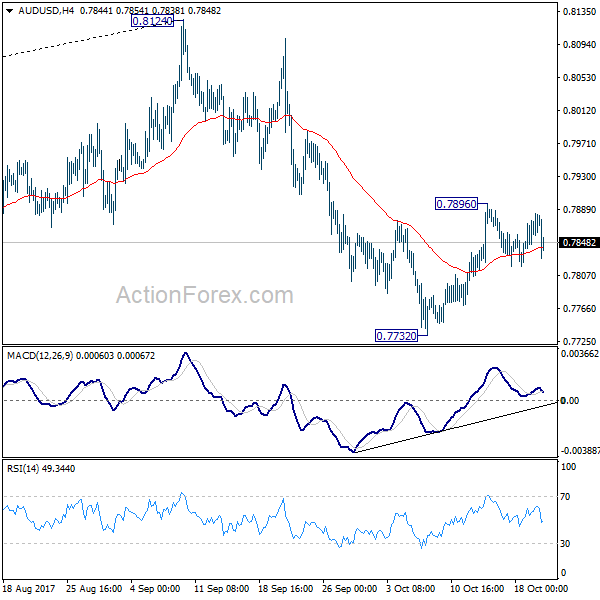
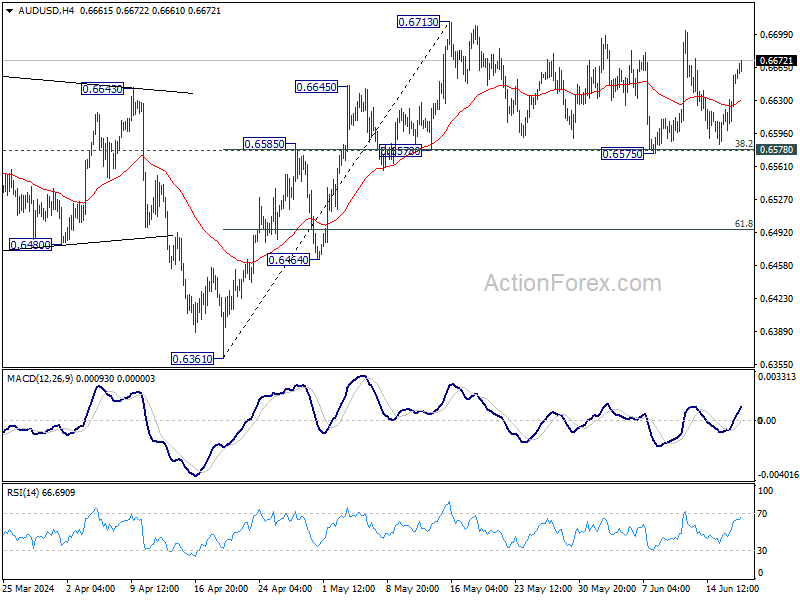
AUD/USD recovers mildly today after drawing support from 4 hour 55 EMA. But it’s staying below 0.7988 temporary top. Intraday bias remains neutral at this point. On the upside, above 0.7988 will extend the rebound to retest 0.8135. On the downside, below 0.7758 will resume the fall from 0.8135 and target 0.7500 key near term support. At this point, there is no strong case for a range breakout yet and 0.7500/8135 could hold for a while.
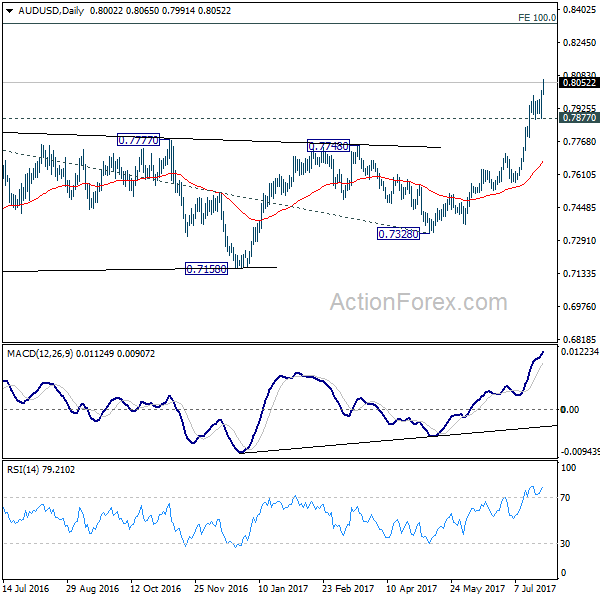
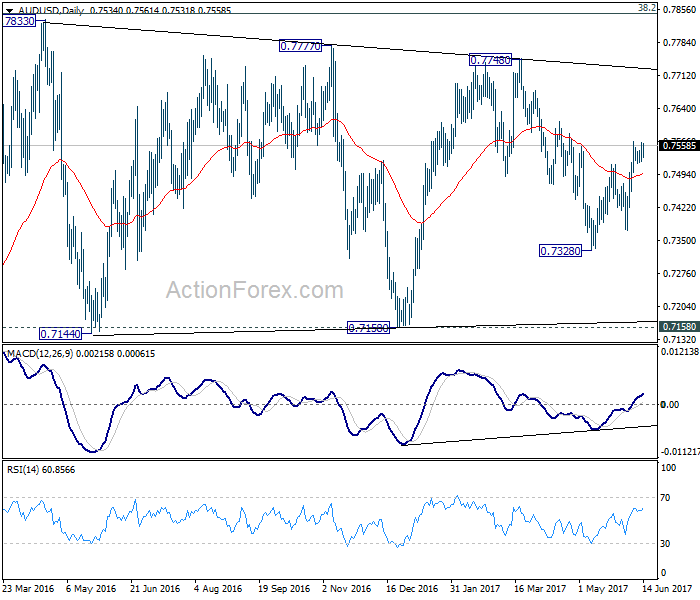
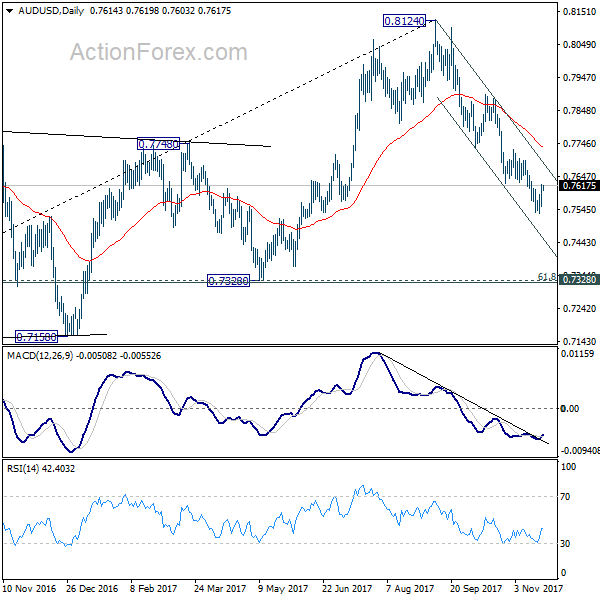
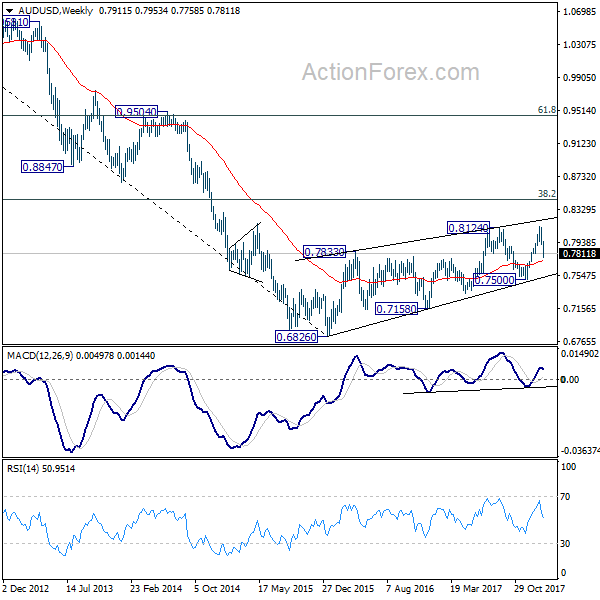
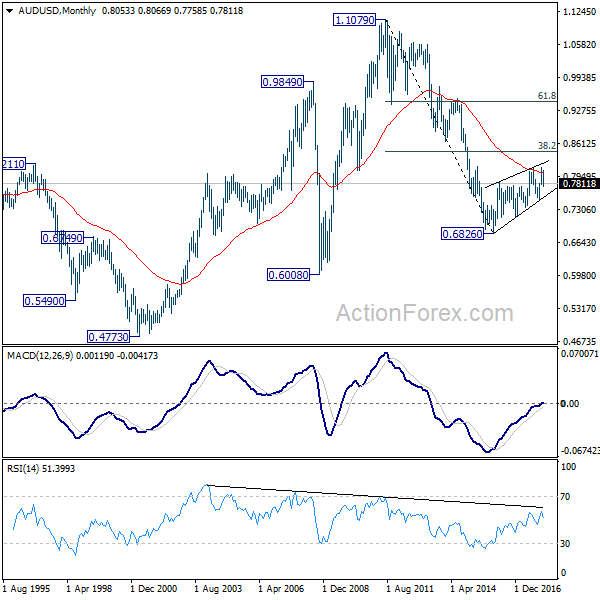
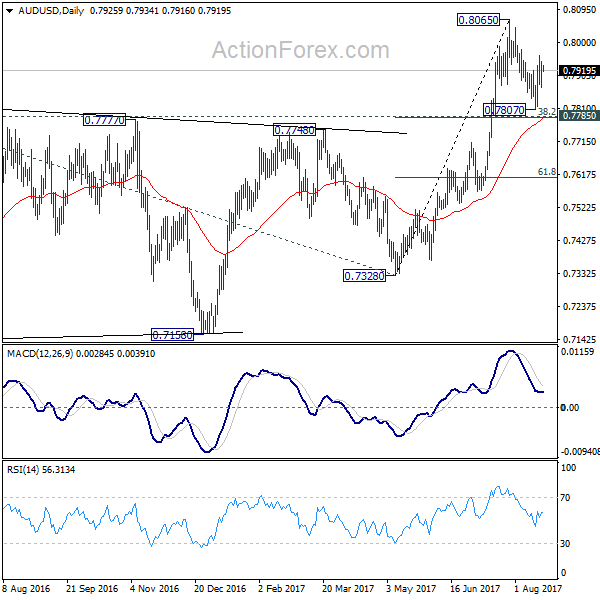
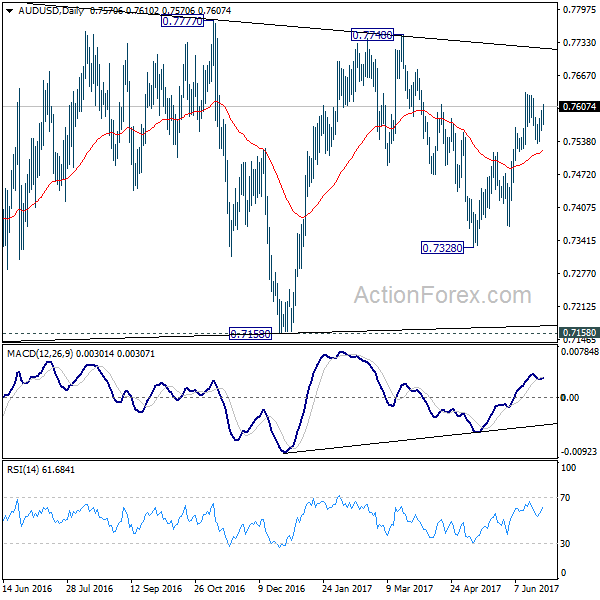
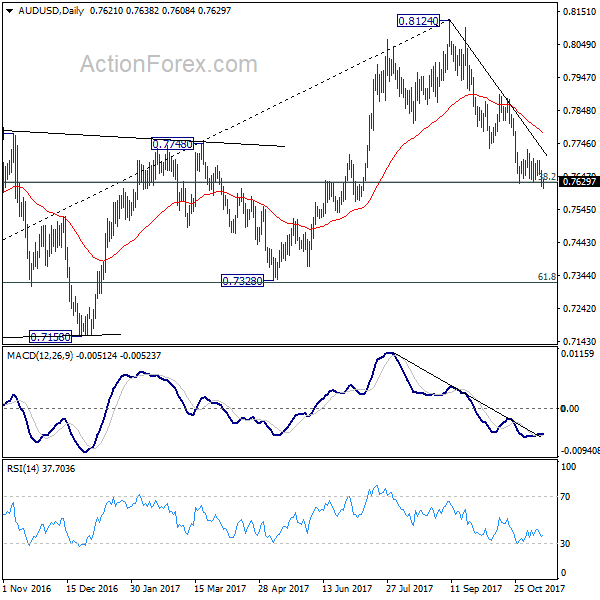
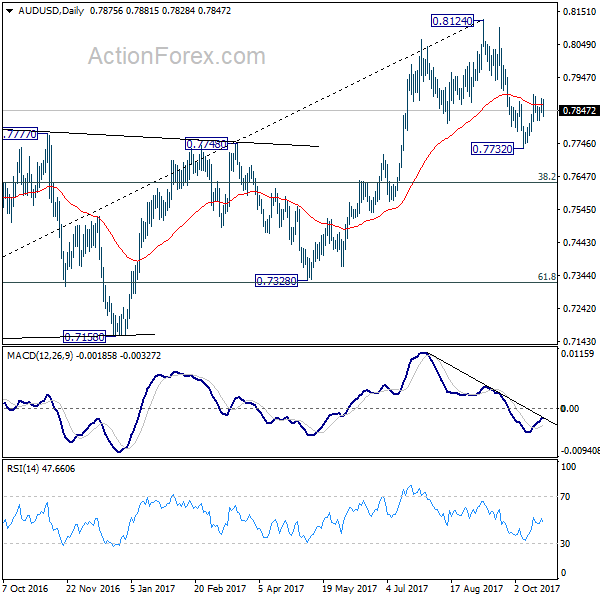
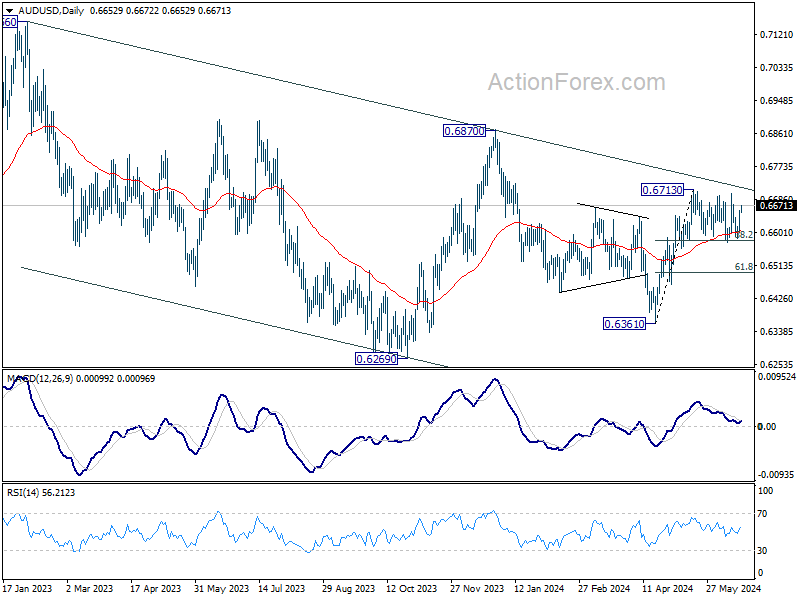
In the bigger picture, medium term rebound from 0.6826 is seen as a corrective move. It might still extend higher but we’d expect strong resistance from 38.2% retracement of 1.1079 to 0.6826 at 0.8451 to limit upside to bring long term down trend resumption. On the downside, break of 0.7500 support will now be an important signal that such corrective rebound is completed.