
Live Comments
Australia NAB business confidence rises to 3, costs ease as activity momentum holds
Australia’s NAB Business Conditions index slipped modestly from 9 to 7 in January, while Business Confidence edged up from 2 to 3. For the RBA, the report showed a clear easing in inflation pressures. Measures of labor and input costs both softened during the month, while quarterly growth in retail prices slowed sharply to 0.3%, down from 0.5% in December.
NAB economist Michael Hayes noted that cost and price indicators have now fallen to "new post-pandemic lows", reinforcing the view that underlying inflation dynamics are continuing to cool.
At the same time, the survey indicates that the broader economy has not lost much traction. Hayes highlighted that activity has "retained most of its momentum gained through the past year" , even as capacity utilization eased slightly.
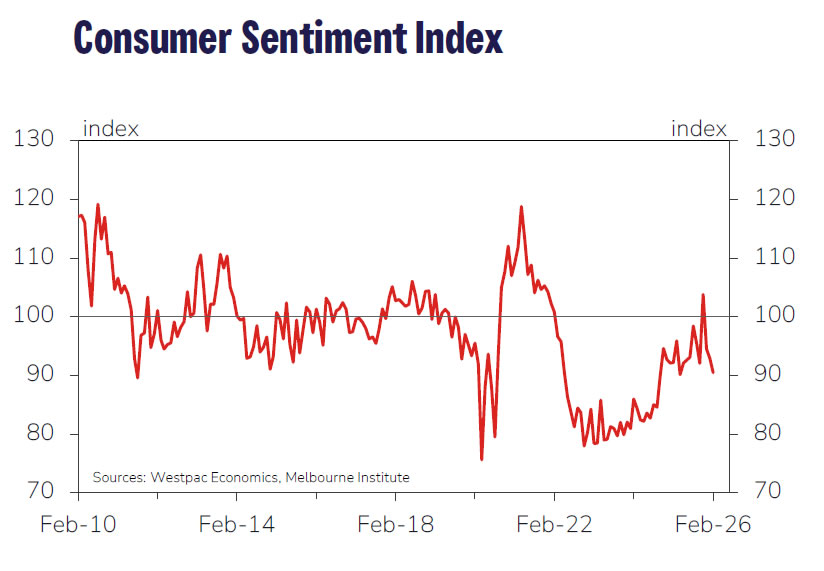
Australia Westpac consumer sentiment dips -2.6% mom after RBA hike, but impact contained
Australia’s Westpac Consumer Sentiment Index fell -2.6% mom to 90.5 in February, reflecting the immediate impact of the RBA’s first rate hike in more than two years. However, Westpac noted that the overall hit to confidence was "relatively mild" by historical standards. The February decline was smaller than the average fall typically seen after rate hikes, and sentiment remains well above the extreme lows recorded through much of 2022–2024.
Looking ahead, Westpac expects the RBA to remain cautious. While another hike at the March meeting cannot be ruled out, the more likely outcome is a pause as policymakers wait for additional data, particularly quarterly inflation updates.
With the RBA placing greater weight on trimmed-mean inflation and the next quarterly CPI report due in late April, Westpac continues to see May as the more probable window for a follow-up 25bp rate hike if inflation remains uncomfortably high.
Lagarde, Nagel reinforce ECB pause as medium-term inflation anchors hold
ECB President Christine Lagarde reiterated overnight that the Governing Council remains comfortable with its current policy stance, telling European lawmakers that inflation is still expected to stabilise at the 2% target over the medium term. In an environment marked by elevated uncertainty, Lagarde stressed that a "data-dependent, meeting-by-meeting approach to monetary policy serves us well."
That message was reinforced by Bundesbank President Joachim Nagel, who said “many factors” point to the current level of interest rates being appropriate. Nagel downplayed recent inflation softness, arguing that the shortfall is "small, temporary deviations", while medium-term inflation dynamics remain firmly aligned with the ECB’s target.
Nagel emphasised that policy action would only be warranted if medium-term inflation expectations deviated “sustainably and noticeably” from target — something he said is clearly not happening.