The ADX or the Average Directional Index indicator is a handy tool that can help traders in a number of ways. For the most part, those who follow a trend trading strategy will discover that the ADX can be a useful addition.
While traders often end up using two or more indicators that basically gives the same information making them redundant, the ADX indicator in fact compliments any other trend based indicators.
In this article, we will look at how you can use the ADX indicator in your trading and more importantly how you can improve your trend trading strategies.
What is the ADX Indicator?
The ADX indicator is available for free on the MT4 trading platform. The indicator comprises of three variables. The +DI, -DI and the ADX line itself. Combined, all these three variables give information to the trader, informing when the trend is strong and also shows what the current trend is.
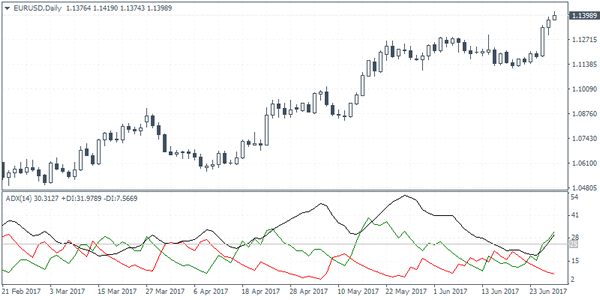
The ADX indicator is shown on the first chart below. Here, we use the standard setting of 14-periods.

ADX Indicator Example
You might notice that the level used for the ADX line is 25. This is quite subjective, and it is up to the trader. The ADX level shows when the trend is strong. Thus, when the ADX line is above 25, it indicates that the underlying trend will most likely continue.
In some cases, traders use the levels of 28 or even set a range of 25 – 28 as well. The above chart shows the ADX indicator for the EURUSD daily chart. Of course, the indicator can be applied to any time frame as well.
How to use the ADX indicator for trend trading?
There are two ways one can use the ADX indicator.
- Determine trends
- Determine the strength of the trends
Each of these two methods is outlined in more detail below.
Determining trends with ADX
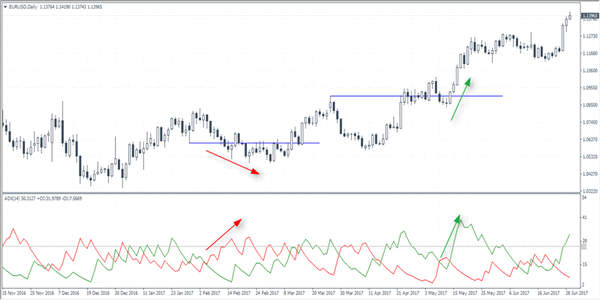
To determine trends with the Average Directional Index, you can simply hide the ADX line. In this instance, the ADX indicator will only show you the +DI and -DI variables.

ADX Trend determination
In the above example, you can see how the +DI and -DI (along with price action) can signal the trends. The first instance shows the bearish trend, depicted by the -DI rising above the falling +DI. This also coincides with a breakdown of prices below the most recent higher low.
Although price action consolidates at this level, we can see the price falling a few pips below the level identified.
In the next example, you can see that major pivot high that was formed. After the pullback, price action broke past this level and surged higher. This bullish short-term uptrend was depicted by the +DI rising while the -DI was falling.
You can use a number of other indicators such as Bollinger bands or moving averages to act as an additional confirmation of the trend.
The trend determination using the ADX can help you to understand which way the markets are going. Combining with price action, you can expect to see sideways markets as well and stay away when the markets are flat.
Determine the strength of trends
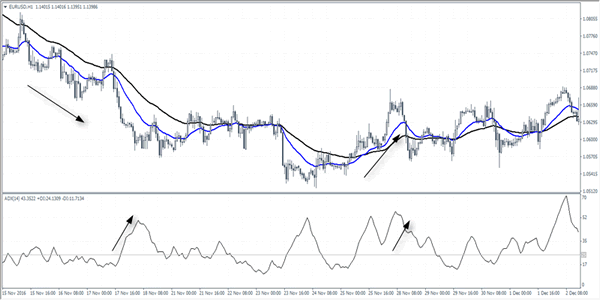
You can also use the ADX to determine the strength of trends. In this example, you will have to use a price overlay indicator on the main chart. In the sub-chart, only the ADX line is used. This can be done by hiding the +DI and -DI levels in the indicator.

ADX Trend Strength
In determining the trend strength, traders can use moving averages on the main chart to understand the trend and use the ADX line to identify when the trend is strong. Because not all trends are powerful, the ADX line is a great way to determine when the trend strength is rising.
This typically coincides with a pullback in price to the moving average before price resumes its trend.
While the above two ways of using the ADX indicator might seem simple, they are in fact very powerful. The ADX indicator can help traders to stay out of the flat market which is where most of the money is lost.
By picking the price when the trend is the strongest, the ADX indicator can compliment any existing trend based trading strategy.
