Consumer Price Index, CPI for short is a measure of the change in the weighted average of prices from a basket of consumer goods and services considered essential.
CPI is calculated by tracking the price changes for each of the items in the basket of goods and weighted in importance.
Inflation data is primarily comprised of two measures:
- Headline inflation: This inflation reading tracks the overall changes and includes energy prices which are volatile
- Core inflation: This inflation reading strips out the volatile energy prices and food and gives a clearer picture of the price changes in the basket of goods
The headline inflation data is usually more volatile compared to the Core inflation rate and has the ability to predict core inflation. The headline inflation is designed to be a best measure of inflation and it is this headline inflation which is usually targeted by Central Bankers.
CPI or inflation data is an important economic release which has the potential to move the short term markets as well as shape monetary policy decisions. After all most central banks have an inflation-targeting mandate.
CPI or Inflation data is released on a monthly basis with some countries releasing flash or preliminary inflation data ahead (EU) of their time.
Typically CPI data released is for the month gone by and is also measured annually for both the core and the headline inflation data.
Countries such as New Zealand and Australia prefer to keep the inflation data on a quarterly basis which offers a less volatile and clearer view on changes in consumer prices.
Some countries also tend to use their own measure of inflation. For example in the Eurozone, HICP or Harmonized Index of Consumer Prices is used, while the US besides the CPI, PCE or Personal Consumption Expenditure data is also used.
Although the terms may sound different, they track the same underlying changes in consumer prices with differences in the way the prices are measured.
Why is Consumer Price Index an important economic report?
The CPI or consumer price index report is an important economic indicator as it signals how quickly prices are rising or falling. When consumer prices rise, it signals inflation, but when prices fail to rise or drop, it signals a period of deflation.
Central bankers use consumer inflation as a gauge to raise/cut/hold interest rates, which acts as a lever to stimulate or hold back consumer spending which in turn influences inflation.
As a result, CPI data is closed watched as strong or prolonged increase or decline in inflation usually results in some Central Bank acting on monetary policy.
Most central banks today build their monetary policy around inflation targeting. This means that the Central Banks have a specific target inflation rate to achieve, which is usually 2%, or in some cases, within a band of 2% – 3%.
Interest rates and monetary policy tools are used in accordance with maintaining the price stability.
Impact of CPI data release on the forex markets
In the currency or forex markets, CPI data is closed watched. This report has gained a lot more significance ever since oil prices started a steady decline making it more difficult for Central Banks to target the 2.0% mandated inflation growth.
Many banks have had to cut interest rates, some into negative as well as having to use other tools such as quantitative easing in efforts to stoke consumer spending and thus push inflation higher.
A good example of the importance of inflation data can be the Bank of Japan and the European Central Bank, which struggled to push inflation back to the mandated target.
When monthly a quarterly inflation report shows a spike or declines further, the markets are quick to speculate what policy action the Central Banks could take based on the information available.
Example of trading the CPI release
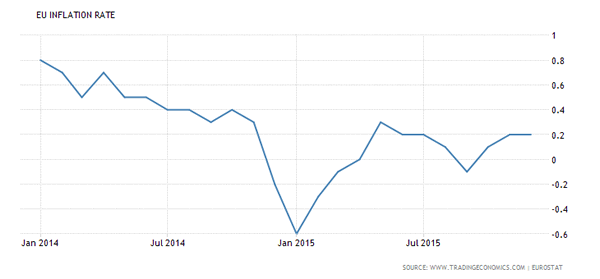
Eurozone CPI (2014 & 2015)
The Eurozone’s annual inflation rate was in a steady decline for most of 2014, at one point falling below zero. The ECB vowed to bring inflation back to its 2.0% target and prepared the markets thereafter that it would consider cutting interest rates to historic lows, cut rates on bank deposit rates and purchase sovereign bonds via the QE program to spur lending.
The chart below shows the Eurozone inflation rate between 2014 January and 2015 December. It was in January 2015 that the ECB announced a massive €60 billion monthly bond purchase program to stoke inflation.

Eurozone Inflation Rate 2014 – 2015
The Euro fell sharply since the ECB announced its intentions, falling from highs of $1.39 to hit $1.12 before the ECB officially announced the dovish monetary policy decision.
To summarize the key points about CPI and how to trade the report:
- Inflation is a measure of the price change in a basket of goods. Inflation is measured as a headline and core inflation which strips the volatile food and energy components
- CPI is released on a monthly and quarterly basis, in some cases as a preliminary estimate. The data is released for the previous month
- While monthly dispersions occur, the annualized inflation rate is what matters
- CPI might have strong or negligible impact depending on the monetary policy conditions
- On the very short term, a surprise in inflation can lead to some intraday trading opportunities
