Risk appetite dominated the markets last week and with global equities having a stellar start to 2018. With that, Japanese Yen and Swiss France ended as the two weakest ones. Dollar attempted to rebound multiple times but failed. Non-farm payrolls data were solid even though the headline number missed expectations. But it nonetheless gives no push for Fed to quicken it’s rate path. Euro was also relatively firm throughout the week, until data showed headline and core inflation slowed in December. Sustainable strength was seen in commodity currencies. In particular, Canadian Dollar ended as the star as double boosted by strong job data and surge in oil price.
DOW nears 25330 projection level
All three major US indices, DOW, S&P 500 and NASDAQ closed at new record highs last week. What’s more impress is the strong momentum as some described as "out-of-the-gate". And first week of the year performance is not seen in decades. Underlying, there is optimism that the Republican’s tax cut would boost corporate profits as well as consumer spending. Non-farm payroll report is seen as another factor prompting the 220 pts rally in DOW on Friday. While the headline job number missed, 148k growth was not a disastrous number that indicated anything bad in the economy. Instead, the small miss could keep Fed cautious on it’s rate path and reduce the risks of over-supressing growth.
With last week’s strong rally, DOW is now inch from 200% projection of 20379.55 to 22179.11 from 21731.12 at 25330.24. There could be some set back from this projection level for retreat. But near term outlook will stay bullish as long as 24876.07 resistance turned support holds. The long term up trend remains in an acceleration phase for next target at 261.8% projection at 26442.36.

FTSE extended record run
FTSE’s record run started late in December after the agreement between UK and EU to move on to trade talks in Brexit negotiation. And such record run continued in the first week of 2018. What’s impressive is that rise in stocks was accompanied by rally in Sterling too. This could have marked a big shift in the underlying forces. That is, FTSE’s strength is no longer driven of Sterling’s depreciation, as it was after Brexit referendum. Instead, business investments could be coming back as there is increasing optimism of at least a smoother Brexit. At the same time, BoE interest rates are still close to record lows. And the central bank will likely stay hold their hands off until the next phase of Brexit negotiation is cleared.
Technically, there was strong support seen from the rising 55 week EMA. And, the long term channel is firmly taken out by the rise since early December. FTSE should now be on track to extend the record run to 61.8% projection of 5499.50 to 7598.99 from 7289.35 at 8586.83 in medium term.

China stocks also rebound strongly
Things are looking good in Asia too with Nikkei hitting 26 year high. Strong rebound was also seen in China’s Shanghai composite. Technically, the SSE index should have defended 55 week EMA as pull back from last year’s high at 3450.49 completed at 3254.17. Retest of 3450.49 should be seen in near term and break will resume long term rise from 2016 low at 2638.30. Momentum of such rise is not too convincing and could just be a corrective move. But still, break of 3450.49 would bring another up leg to 38.2% retracement of 5178.19 to 2638.30 at 3608.53.

WTI breached 62 with strong rally
Another key development in the past two weeks was the rally in oil price. WTI crude oil extended the long term rebound from 26.05 (2016 low) and hit as high as 62.04. Based on the current momentum, WTI should have least have a test on the next cluster resistance level at 66.87/67.53. They are 50% retracement of 107.68 to 26.05 at 66.87 and 100% projection of 26.05 to 51.67 from 42.05 at 67.53. This bullish view will hold as long as 56.09 support holds.

Trading strategy
The above analysis suggests that risk appetite is here to stay globally. Yen and Swiss Franc will likely remain the weakest ones in near to medium term. Canadian Dollar was boosted by stellar employment data release on Friday, which sealed the deal for BoC to hike again in Q1. And the central bank could indeed raise interest rate as soon as during the January meeting. And above mentioned bullish outlook in oil price will only give the Loonie more strength. Given these conditions, going long in CAD/JPY is what we’d suggest for position trading.
With last week’s rise, CAD/JPY yet to take out 91.62 resistance. There could be some consolidations early this week before CAD/JPY surges pass through 91.62. Hence, we’ll try to buy it on pull back to 90.00, or on break of 91.70 (slightly above 91.62). 61.8% retracement of 106.48 to 74.80 at 94.37 is first target. While bearish divergence condition is seen it weekly MACD, the structure of the rise from 74.80, with strong impulsive upmove, suggests that it’s more a 1-2-i-ii pattern, than a triangle. Hence, we’d probably see more upside acceleration ahead powering through 94.37 toward 106.48 in medium term.

USD/JPY Weekly Outlook
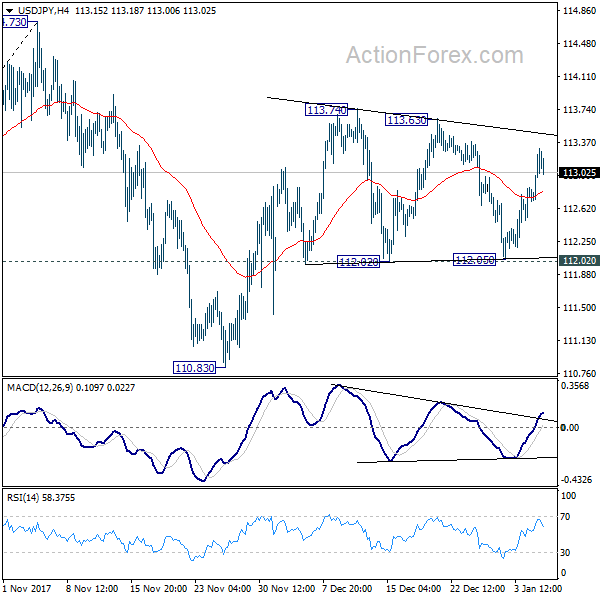
USD/JPY dipped to 112.05 last week but was supported above 112.02 and rebounded. As the pair stays in range of 112.02/113.74, initial bias remains neutral first. But again, outlook remains cautiously bullish as long as 112.02 holds and further rise is in favor. Break of 113.74 will resume the rebound from 110.83 and target 114.73 key resistance. Decisive break there will carry larger bullish implications. However, break of 112.02 will likely extend the corrective pattern from 114.73 with another leg through 110.83 support.
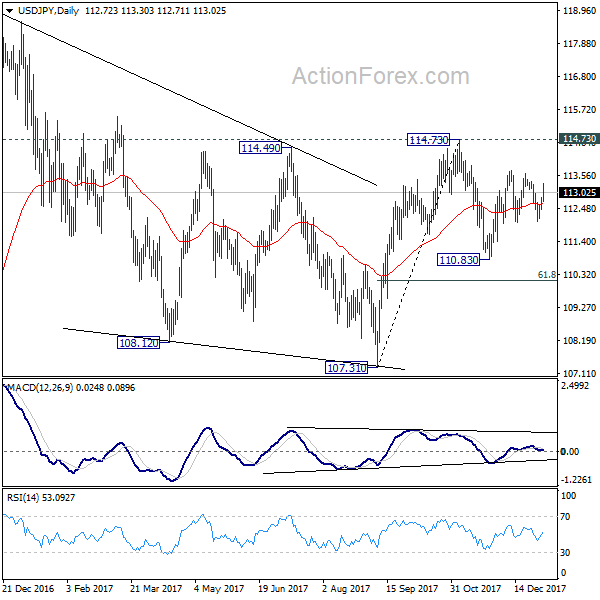
In the bigger picture, we’re holding on to the view that correction from 118.65 is completed at 107.31. And medium term rise from 98.97 (2016 low) is going to resume soon. Sustained break of 114.73 should affirm our view and send USD/JPY through 118.65. However, break of 107.31 will dampen this view and extend the medium term fall back to 98.97 low.
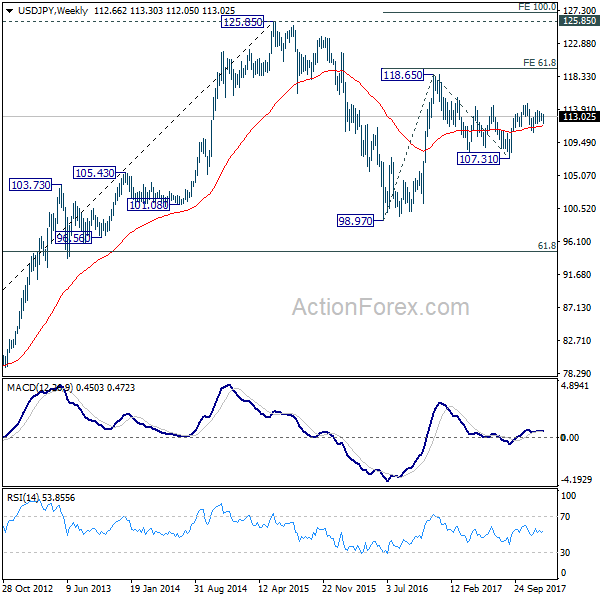
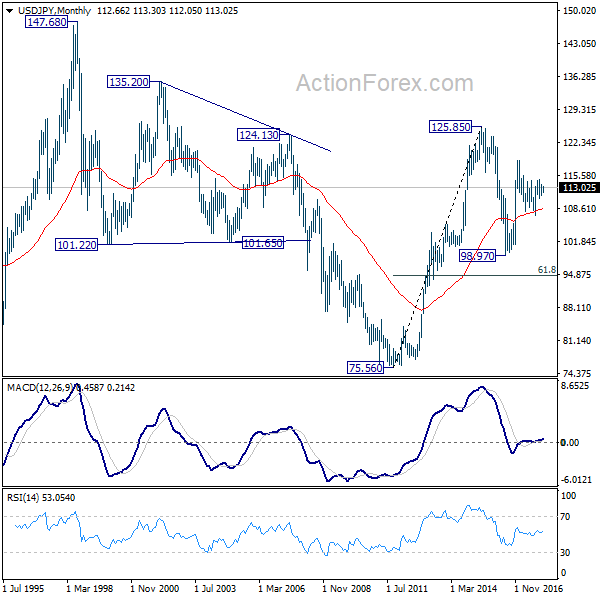
In the long term picture, the rise from 75.56 (2011 low) long term bottom to 125.85 top is viewed as an impulsive move, no change in this view. Price actions from 125.85 are seen as a corrective move which could still extend. In case of deeper fall, downside should be contained by 61.8% retracement of 75.56 to 125.85 at 94.77. Up trend from 75.56 is expected to resume at a later stage for above 135.20/147.68 resistance zone.