Global financial markets last week were influenced by a combination of clarity and uncertainty. In the US, economic data reinforced expectations of a gradual and measured policy easing path by Fed. Investors embraced the prospect that Fed would not repeat the aggressive 50 bps rate cut implemented in September. This optimism regarding a soft landing for the US economy propelled stock markets to new record highs, with gains observed across a broad range of sectors.
In contrast, ambiguity surrounding China’s fiscal stimulus measures led to significant volatility in Asian markets. Traders offloaded stocks in Hong Kong and mainland China, reversing some of the recent strong rallies. The lack of a clearly defined fiscal policy roadmap from Chinese authorities has unsettled investors. This volatility is likely to persist until more concrete fiscal plans are unveiled, as uncertainty prompts many investors to reduce exposure rather than risk unforeseen downturns.
In the currency markets, Swiss Franc emerged as the strongest performer, narrowly outperforming the Dollar, which was the second strongest. The greenback is approaching key technical levels alongside 10-year Treasury yield, which will be critical in determining whether Dollar is reversing its near-term downtrend. Japanese Yen was the third strongest currency, completing the trio of traditional safe-haven assets that benefited amid uncertainties.
On the weaker side, Canadian Dollar ended the week as the worst performer, followed by New Zealand Dollar and Australian Dollar. Despite robust employment data from Canada, the Loonie struggled due to firm market expectations of swift policy easing by BoC. Kiwi remained under pressure following RBNZ’s 50 bps rate cut. Both Kiwi and the Aussie were additionally weighed down by the uncertainty clouding China’s economic policies.
US Stocks Hit New Records, Dollar Index and 10-Year Yield Approach Resistance
Stronger-than-expected inflation data has not deterred investor optimism regarding the US economic outlook. Markets are increasingly confident that Fed a gradual approach to policy normalization. Equities are responding positively, with major indices hitting new highs
While Dollar was taken higher by rising Treasury yields, both Dollar Index and 10-year yield are now facing key resistance levels. The next move would decide whether current bounces in both are reversing the prior down trend, or just correcting it.
The case for a 25bps rate cut by Fed in November solidified with the stronger-than-expected September CPI data. This expectation aligns with the insights from the latest FOMC minutes, which revealed a more intense debate over the September 50bps rate cut than the voting outcome suggested. Investors appear unfazed by the reduced probability of a larger 50bps cut at the upcoming meeting, instead expressing optimism about a soft landing—or even no landing—for the US economy.
This bullish sentiment propelled both DOW and S&P 500 to new record highs, concluding a winning week. The major indices notched their fifth consecutive week of gains, with S&P 500 and NASDAQ Composite each climbing 1.1%, while DOW advanced 1.2%. The rally was broad-based, indicating confidence in the resilience of the economy despite lingering inflationary pressures.
Simultaneously, funds flowed out of Treasuries, causing the 10-year yield to surge and close above the psychologically significant 4% mark. The rise in yields provided support to Dollar Index, which ended the week higher.
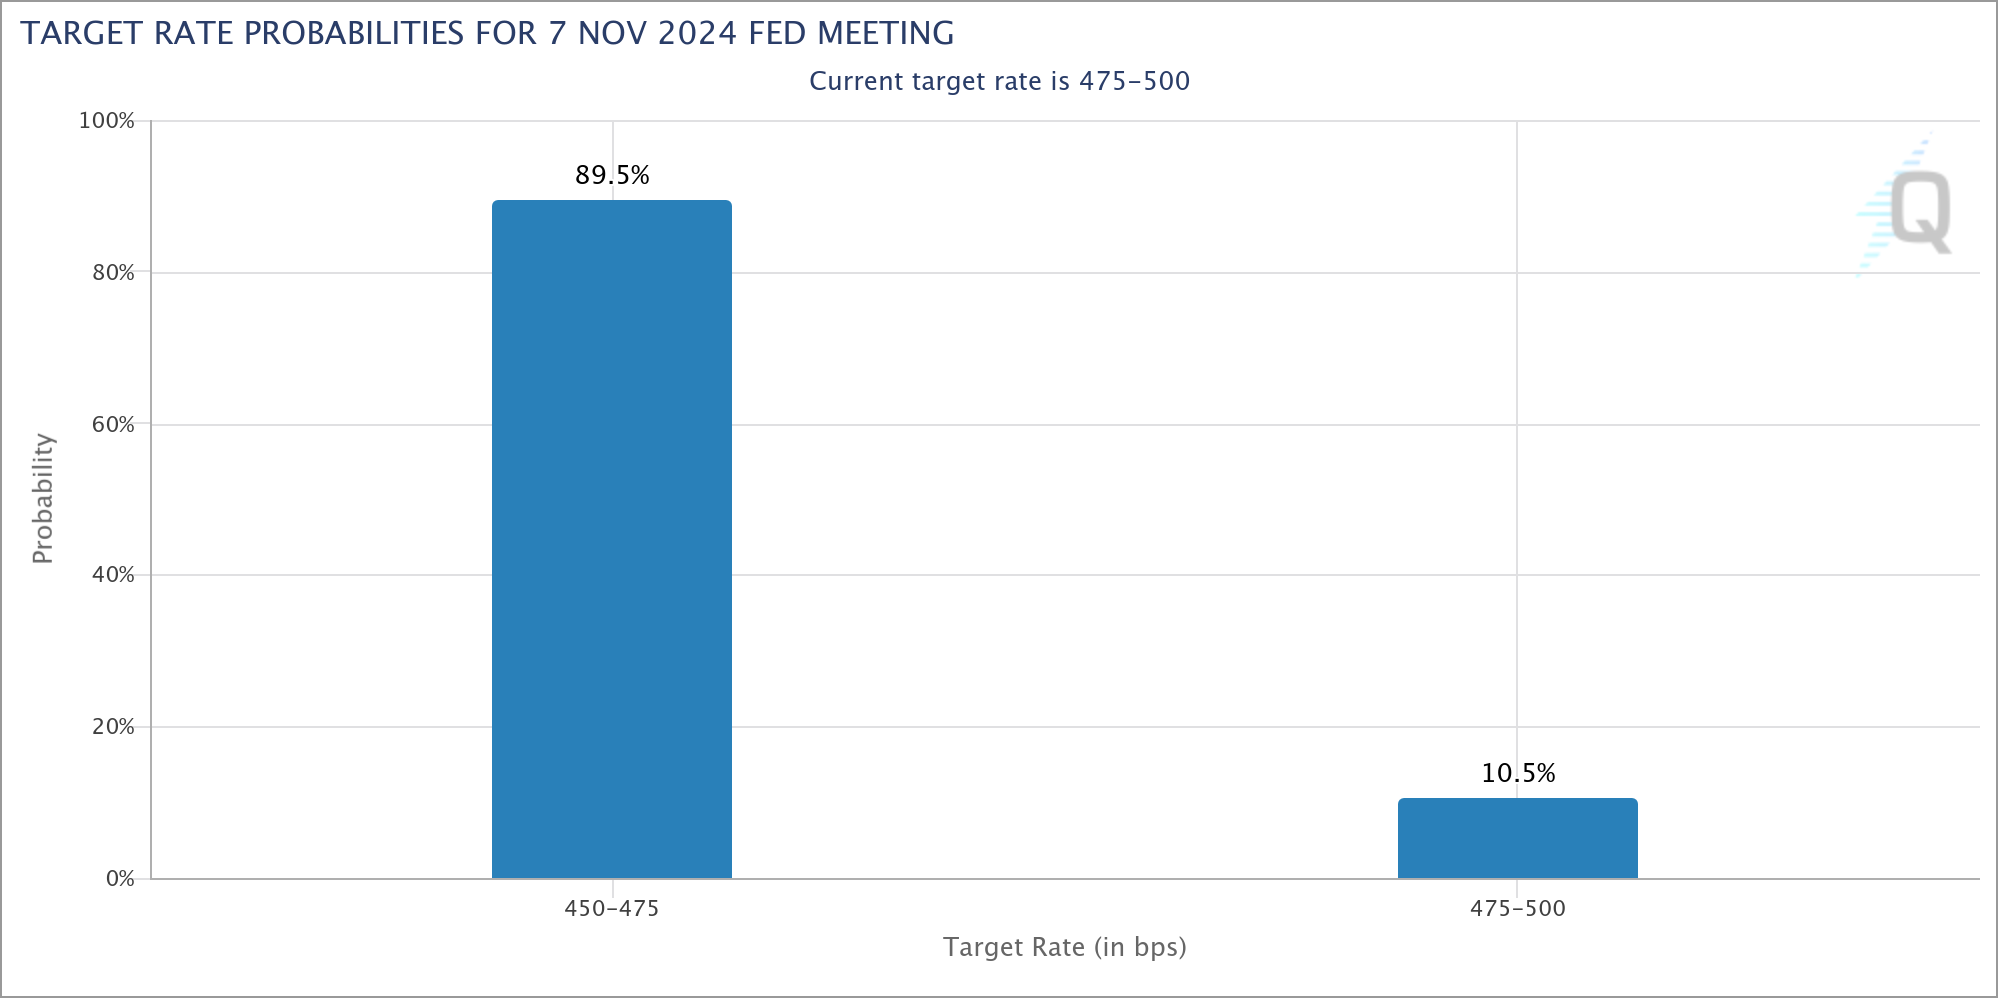
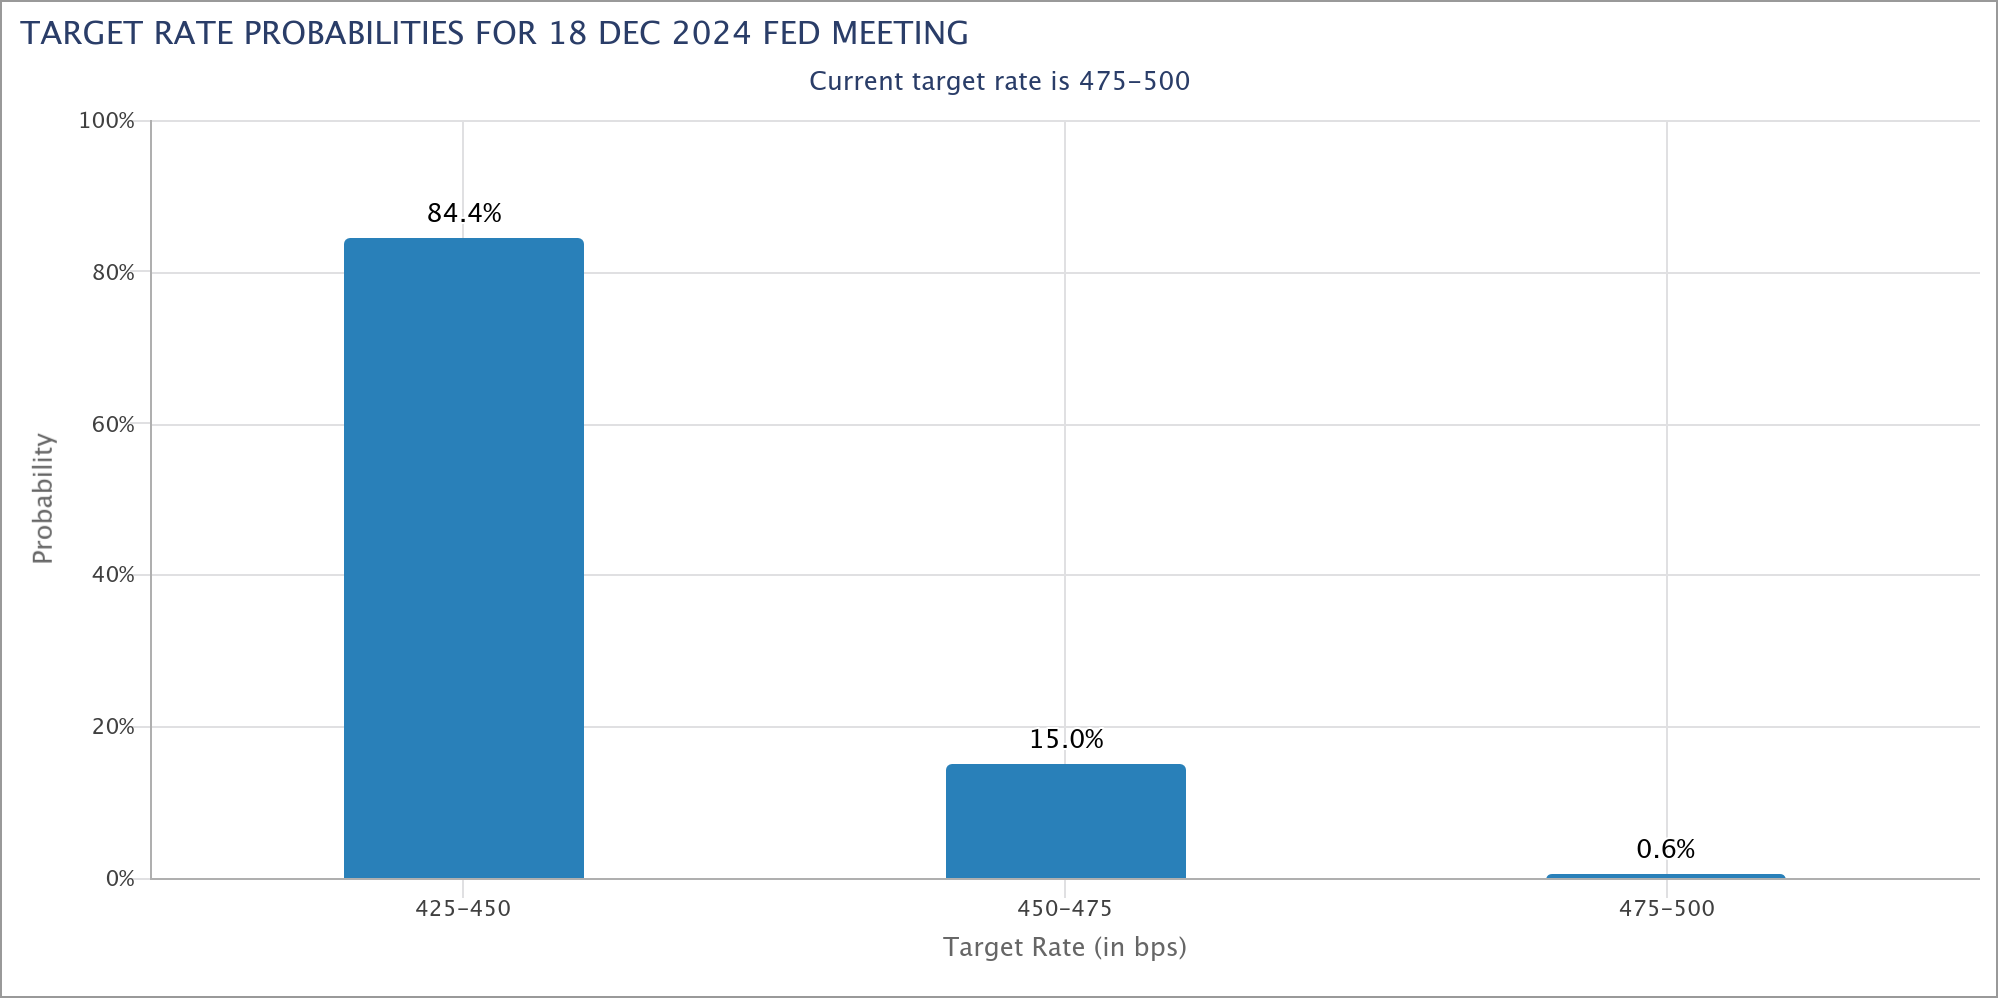
Currently, fed fund futures are now pricing in a nearly 90% chance of a 25bps rate cut in November, dropping rates to 4.50%-4.75%, with around 10% chance of no change. For December, futures indicate an 85% likelihood of another 25bps cut.
Technically, DOW finally broke through 61.8% projection of 32327.20 to 39889.05 from 38000.96 last week. Near term outlook will now stay bullish as long as 41831.74 support holds. Next target is 100% projection at 45562.81.
Medium term momentum is also healthy as seen in W MACD. Outlook will stay bullish as long as 55 W EMA (now at 38757.11) holds. Current rise from 28660.94 (2022 low) is in progress for 100% projection of 18213.65 to 36952.65 from 28660.94 at 47399.94.
While 10-year yield extended the rebound from 3.603, it’s now in proximity to a key fibonacci resistance of 38.2% retracement of 4.997 to 3.603 at 4.135. This is also close to 55 W EMA (now at 4.074). Strong resistance could be seen there to limit upside, at least on first attempt. Break of 4.004 support will bring deeper pullback to 55 D EMA (now at 3.909).
However, from a pure technical perspective, it’s plausible that correction from 4.997 (2023 high) has completed with three waves down to 3.603. With 3.253 cluster support (38.2% retracement of 0.398 to 4.997 at 3.240) intact, the up trend from 0.398 (2020 low) remains in force. So, sustained trading above 4.135 will add to the medium term bullish case, and trigger stronger rise towards 4.737/997 resistance zone.
Dollar Index’s rebound from 100.15 extended higher last week. Rally from 100.15 is seen as an up- leg inside the sideway pattern from 99.57 (2023 low). Further rise is in favor as long as 55 D EMA (now at 102.13) holds. Sustained break of 55 W EMA (now at 103.47) would bring stronger rally towards 106.13/107.34 resistance zone.
However, pullback in 10-year yield could cap Dollar Index at 55 W EMA. In this case, firm break of 55 D EMA in DXY would suggest a reversal back toward 100.15 low
China’s Fiscal Ambiguity Sparks Volatility, HSI Defending Critical 20k Level
Hong Kong and China markets saw extended huge volatility as investor reacted to the absence of detailed fiscal stimulus from China’s National Development and Reform Commission. Following the substantial monetary package announced last month, expectations were high for concrete fiscal support to bolster the slowing economy. However, the NDRC’s post-holiday press conference provided little in terms of specifics, leading to a deep sell-off in Hong Kong while China’s also ended lower after initial spike. This disappointment extended its impact to the currency markets, where both Aussie and Kiwi weakened, despite strong risk-on sentiment in the US.
Attention now shifts to the market’s reaction on Monday following announcements from China’s Finance Ministry on Saturday. Finance Minister Lan Foan pledged to “significantly increase” government debt to revive the faltering economy. Measures include assisting local governments with debt issues, providing subsidies to low-income households, supporting the property market, and replenishing capital for state-owned banks.
However, the absence of specific figures regarding the size of the stimulus package has left investors uncertain about the effectiveness and scale of these initiatives. The lack of numerical details would prolong investors’ wait for a clearer policy roadmap. This uncertainty is expected to continue until the next meeting of China’s legislature, which is responsible for approving additional debt issuance. Although the date for this meeting has not been announced, it is anticipated in the coming weeks.
Technically, despite the huge volatility, HSI’s outlook will stay bullish as long as 38.2% retracement of 14794.16 to 23241.74 at 20014.76 holds, i.e. 20k psychological level. Firm break of 23241.74 and sustained trading above 55 M EMA (now at 21701.78) will suggest that HSI is already revering the long term down trend from 33484.08 (2018 high).
However, decisive break of 20k will suggest that prior rebound, while impressively strong, was merely part of a corrective move. That would also indicate rejection by the 55 M EMA and set up further decline to resume the long term down trend.
As for China’s Shanghai SSE, key support lies in 3174.26 prior resistance, which is close to 50% retracement of 2635.09 to 3674.40 at 3154.74. Further rally would remain in favor as long as this level holds.
However, firm break of 3174.26 should confirm rejection by key resistance at 3731.69 (2021 high). In this case, the strong rebound from 2635.09 is merely an up-leg an the long term range pattern, and should have completed.
AUD/USD Weekly Report
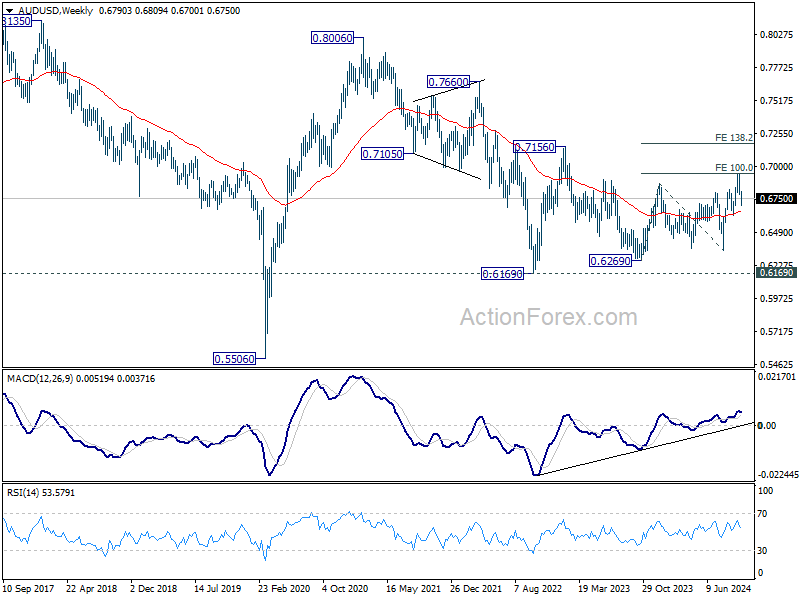
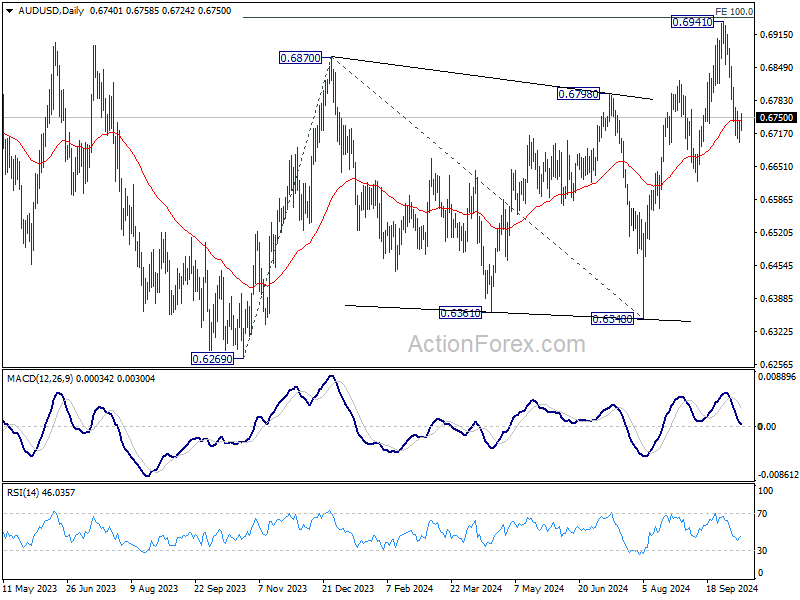
AUD/USD’s fall from 0.6941 short term top extended to 0.6701 last week but recovered since then. Initial bias stays neutral this week first. On the downside, break of 0.6701 and sustained trading below 55 D EMA (now at 0.6743) should confirm rejection by 0.6941 fibonacci level. Intraday bias will be back on the downside for 0.6621 support next. On the upside, however, break of 0.6809 minor resistance will bring retest of 0.6941 high instead.
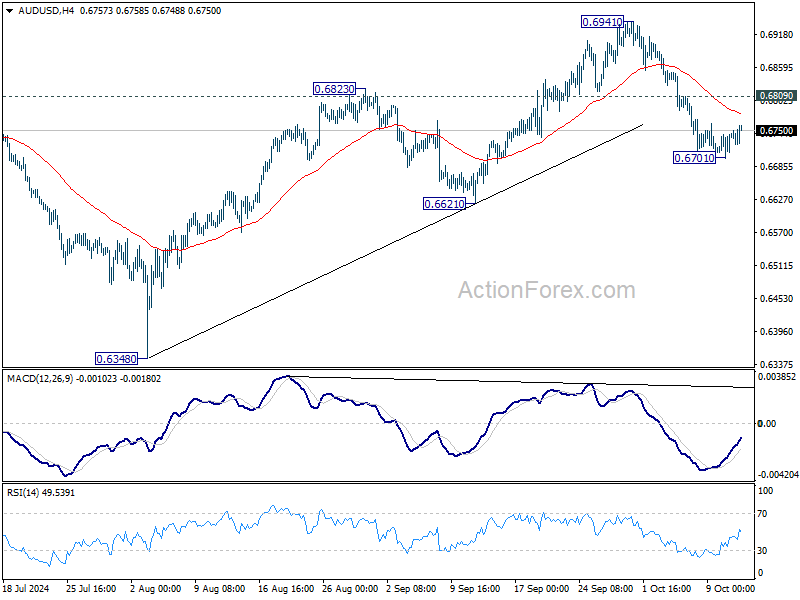
In the bigger picture, overall, price actions from 0.6169 (2022 low) are seen as a medium term corrective pattern, with rise from 0.6269 as the third leg. Firm break of 100% projection of 0.6269 to 0.6870 from 0.6340 at 0.6941 will target 138.2% projection at 0.7179. However, break of 0.6621 support will argue that rise from 0.6269 has completed and bring deeper fall back to 0.6269/6348 support zone.
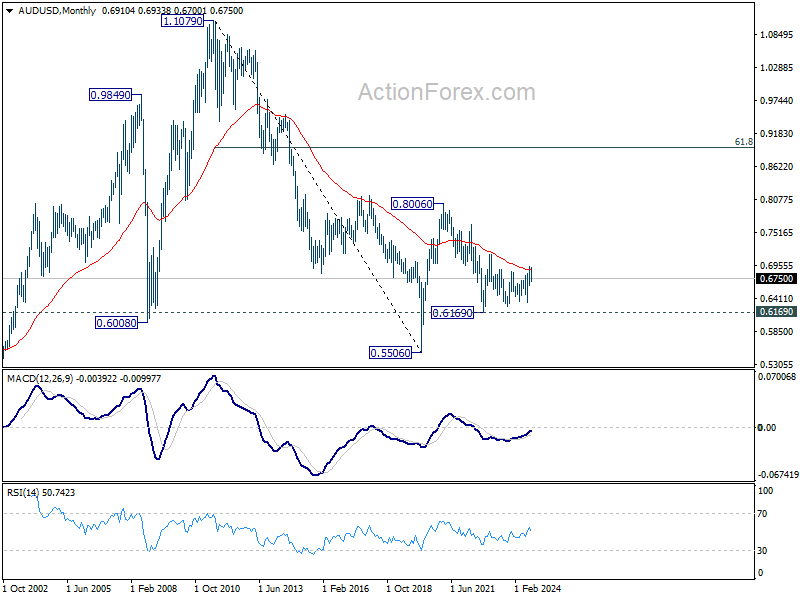
In the long term picture, the down trend from 1.1079 (2011 high) should have completed at 0.5506 (2020 low) already. It’s unsure yet whether price actions from 0.5506 are developing into a corrective pattern, or trend reversal. But in either case, fall from 0.8006 is seen as the second leg of the pattern. Firm of 0.7156 resistance will argue that the third leg has already started towards 0.8006.