The global financial markets started last week in a state of panic, driven by a sharp selloff in stock markets, with Japan’s Nikkei index experiencing particularly heavy losses. However, as the week progressed, this initial wave of panic appeared to subside, with market sentiment stabilizing somewhat.
This calmness, however, should be viewed with caution. The markets may have simply entered a temporary consolidation phase rather than a full reversal. Underlying investor sentiment remains fragile, a fact underscored by the aggressive expectations in the futures markets, where traders are now pricing in a significant 50 bps rate cut by Fed in September. There has even been talk of the possibility of an emergency inter-meeting rate cut, reflecting the nervousness in the markets.
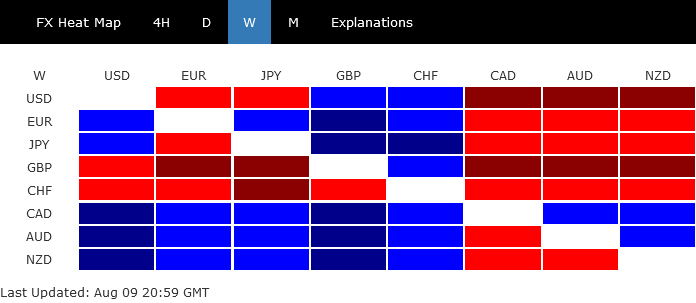
In the currency markets, Canadian Dollar ended the week as the strongest performer. Australian and New Zealand Dollars followed behind, benefiting from slight recovery in risk appetite. On the opposite end of the spectrum, Swiss Franc was the worst performer, followed by British Pound and Dollar, both of which struggled amid mixed economic signals. Euro and Japanese Yen found themselves in middle positions.
It’s important to highlight that the price movements seen in the currency markets this week were largely corrective in nature. For instance, Japanese Yen and Swiss Franc, both of which saw significant gains during the height of the market panic, seemed to be consolidating those gains rather than building on them. Similarly, commodity currencies such as Canadian and Australian Dollars, while showing strength, were primarily recovering from earlier losses. This suggests that the markets have turned into a wait-and-see mode, with participants reluctant to make decisive moves until more clarity emerges.
Recession Fears Fuel Speculation of Aggressive Fed Rate Cuts, NASDAQ and Dollar Index Face Critical Support
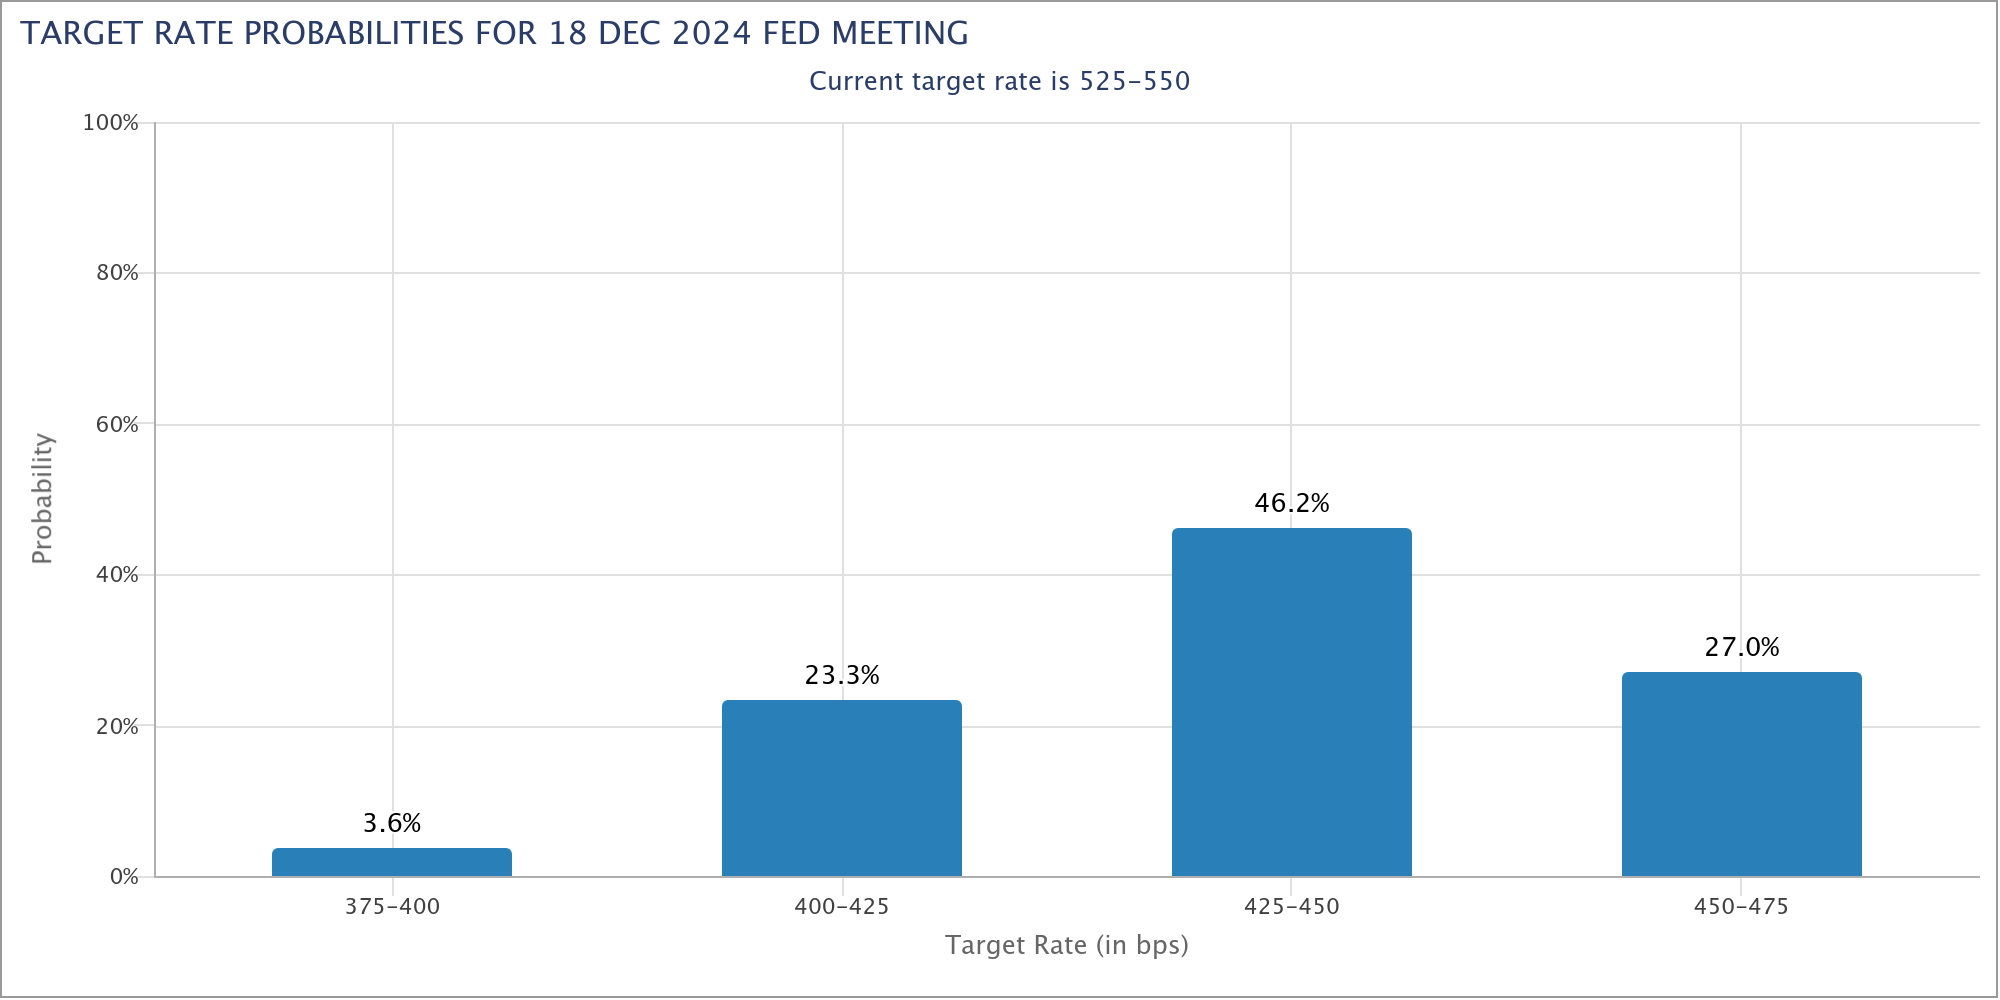
As concerns over a US recession intensified, traders are increasingly positioning themselves for a more aggressive response from Fed. Currently, Fed fund futures are signaling a 49% likelihood of a significant 50 bps rate cut at the September meeting, which would lower the federal funds rate to a range of 4.75-5.00%.
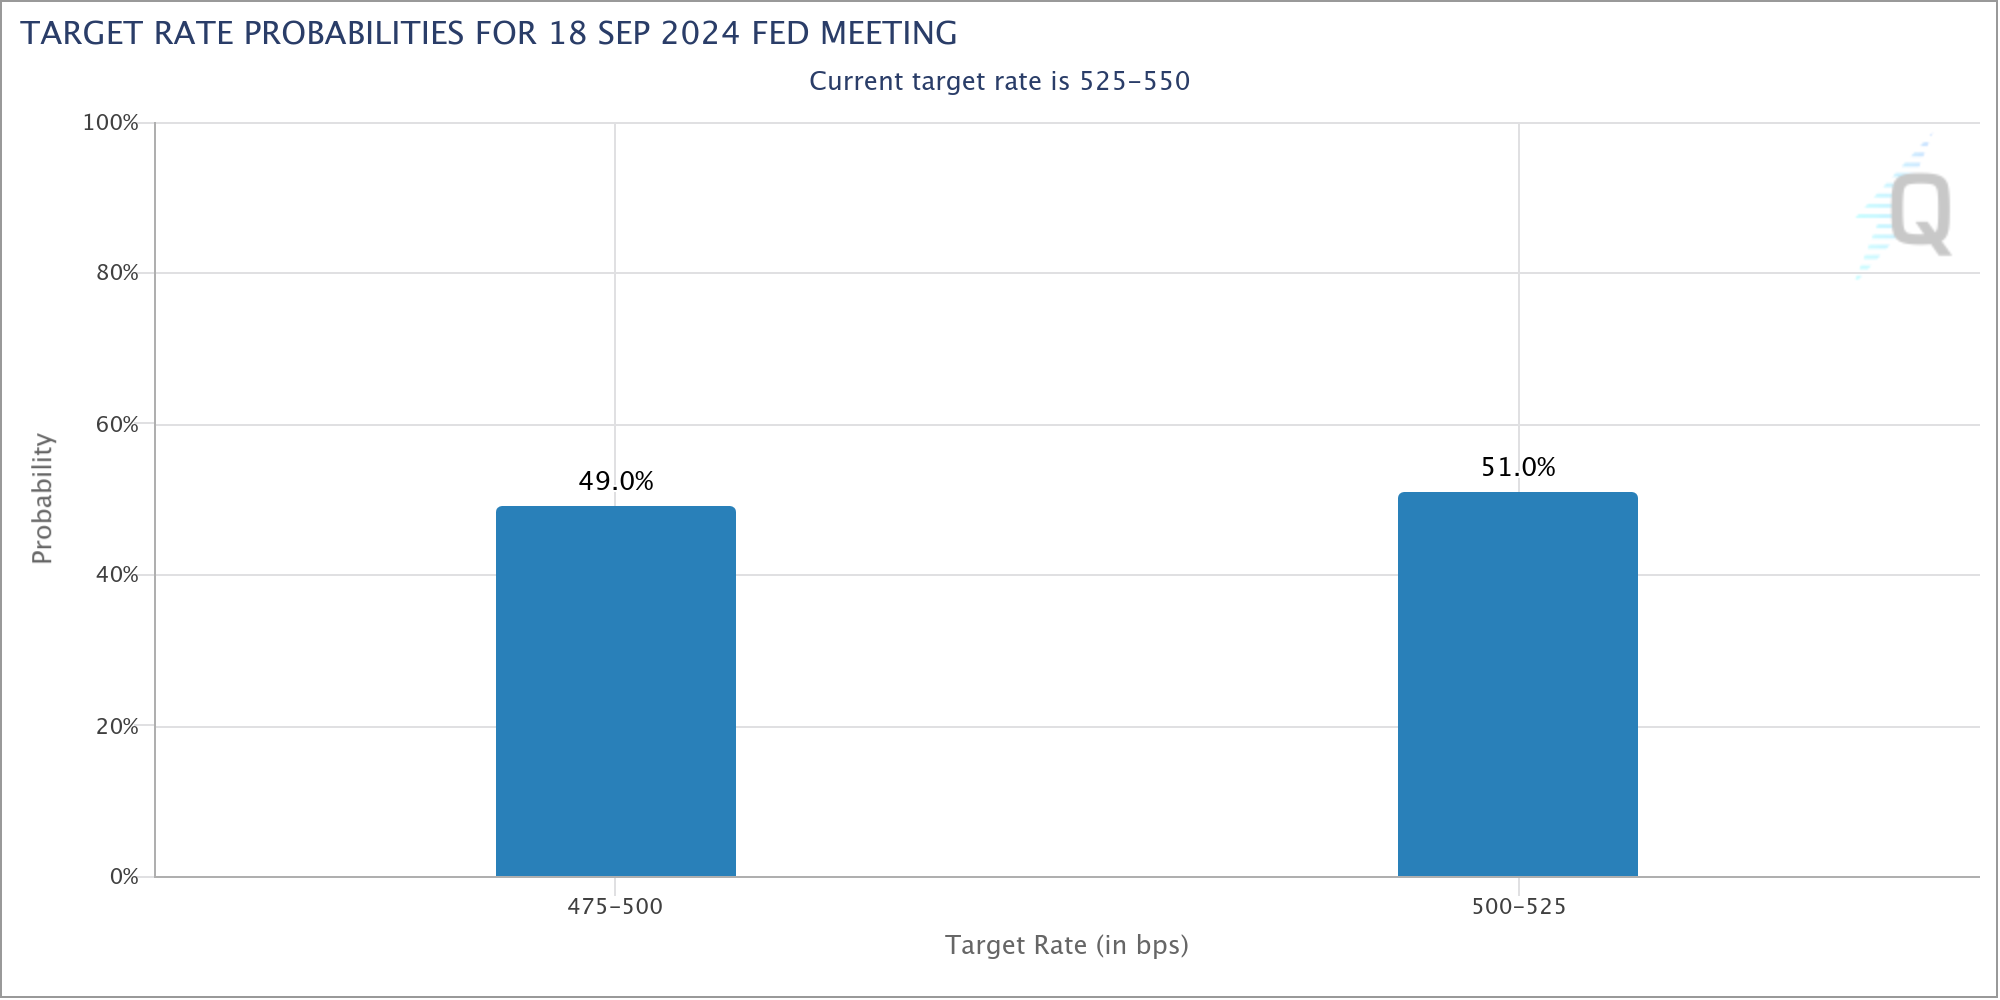
Moreover, the markets are now factoring in additional rate cuts in November and December, which could see the rate drop by a total of 100 bps to 4.25-4.50% by the end of 2024. The probability of this scenario is estimated at 83%, reflecting a growing consensus that Fed may need to act decisively to counter economic weakness, and the market turmoils.
Despite these market expectations, Fed officials have remained composed, viewing recent data on the labor market as indicative of a slowing economy rather than an impending recession. There has been no indication of panic among policymakers, who appear to be taking a measured approach.
This sentiment is echoed by economists, who, according to a recent Bloomberg survey conducted between August 6-8, overwhelmingly expect only a modest 25 bps cut in September. The view is that calls for a more substantial 50 bps cut are overreaction, driven more by recent stock market volatility, with no substantial economic shock to justify such a move.
With more than a month to go before FOMC’s next policy meeting on September 17-18, there is still ample time for market dynamics to evolve. Key data releases, including two sets of CPI data scheduled for release on the coming Wednesday and September 11, as well as the non-farm payrolls report on September 6, will be critical in shaping Fed’s decision. Additionally, there remains risks for further declines in stock markets and bond yields during this period.
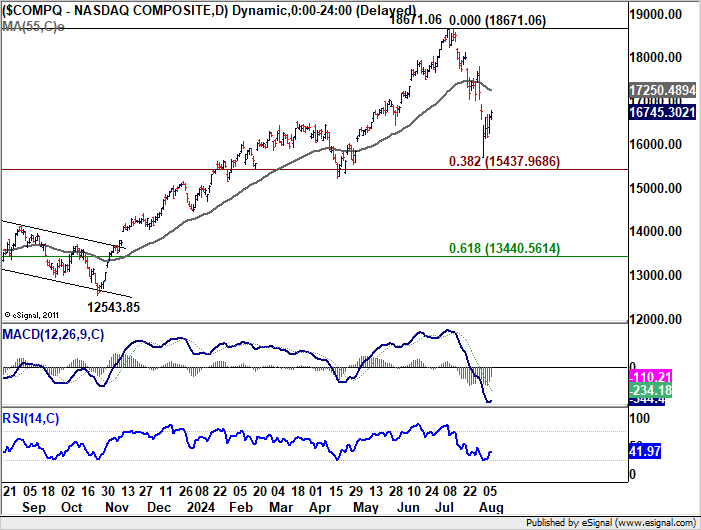
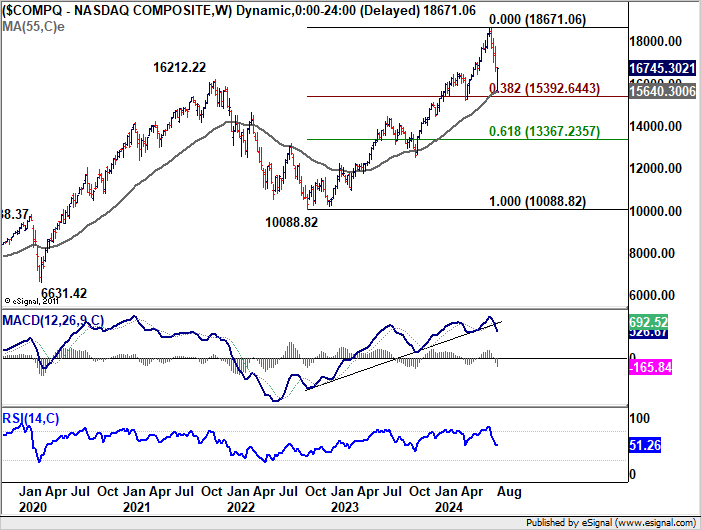
Technically, NASDAQ’s recovery from last week’s low at 15708.53 is so far corrective looking. Thus, near term risks stay on the downside. The key question is whether NASDAQ could defend the support zone between 55 W EMA (15640.28) and 38.2% retracement of 10207.47 to 18671.06 at 15437.96 on next week. Strong rebound from there, followed by firm break of 55 D EMA (now at 17250.48) will indicate that the correction from 18671.06 has completed, and keep the medium term up trend intact.
However, sustained break of the mentioned support zone will argue that a larger scale correction is already underway. Next downside target will be 61.8% retracement at 13367.23.
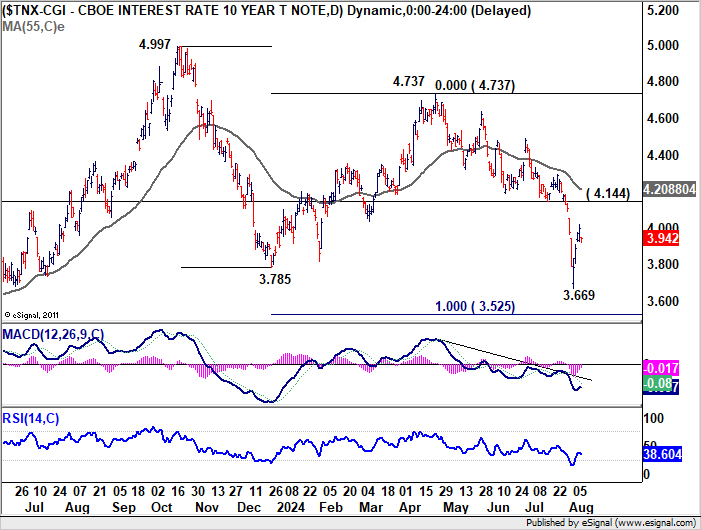
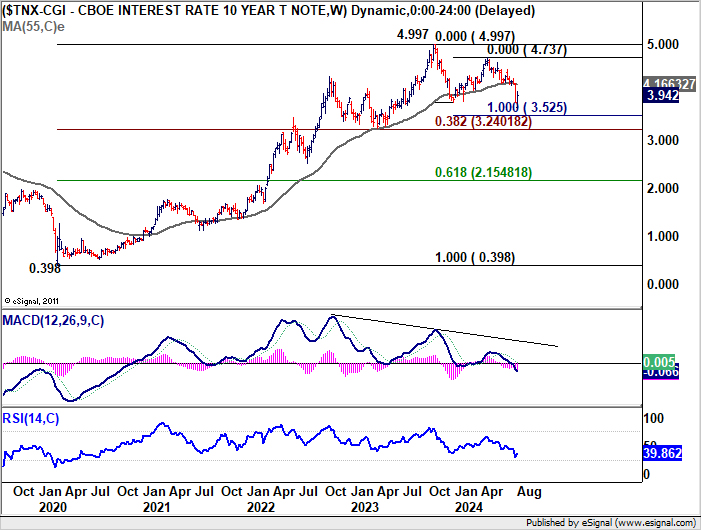
10-year yield dived through 3.785 support to resume the whole decline from 4.997. But it recovered strongly after hitting 3.669, and even breached 4.000 mark. But still, near term outlook will stay bearish as long as 4.144 support turned resistance holds. Below 3.669 will target 100% projection of 4.997 to 3.785 from 4.737 at 3.525, or even further to 38.2% retracement of 0.398 to 4.997 at 3.240.
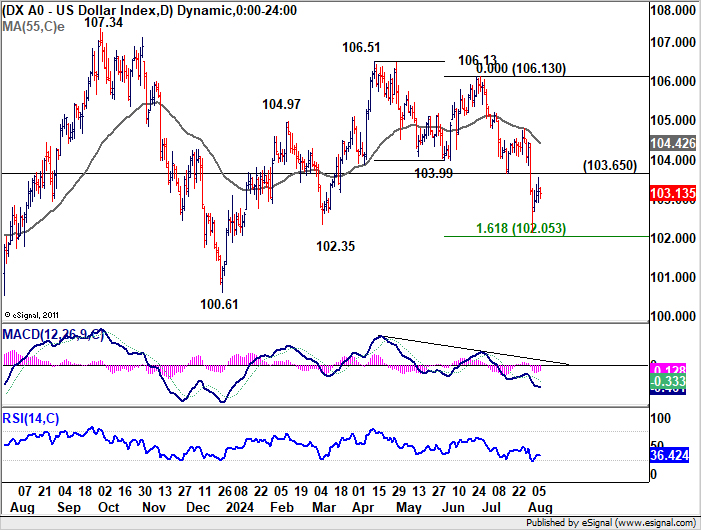
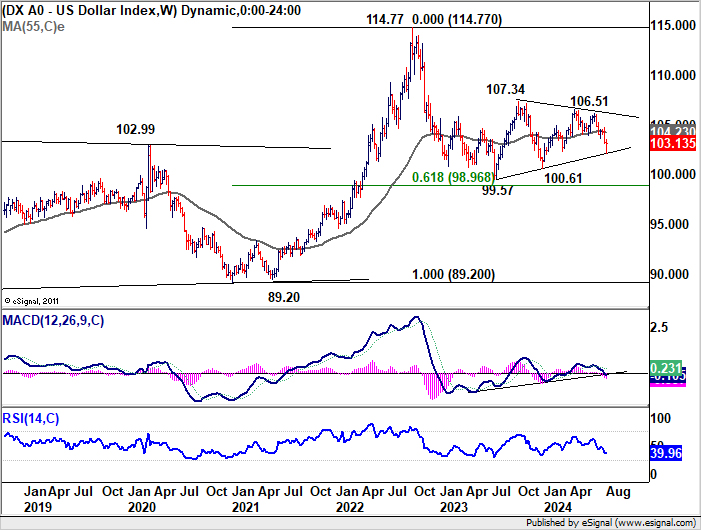
As for Dollar index, despite last week’s recovery, near term outlook will stay bearish as long as 103.65 support turned resistance holds. The key level is 100% projection of 106.51 to 103.99 from 106.13 at 102.05. Decisive break there, which is close to long term trend line support, could prompt downside acceleration through 102.35 support towards 100.61 low. Nevertheless, sustained break of 103.65 will bring stronger rebound towards 55 D EMA (now at 104.42), even as a corrective move.
Nikkei Stabilizes After Historical Plunge, DAX Faces Downside Risks
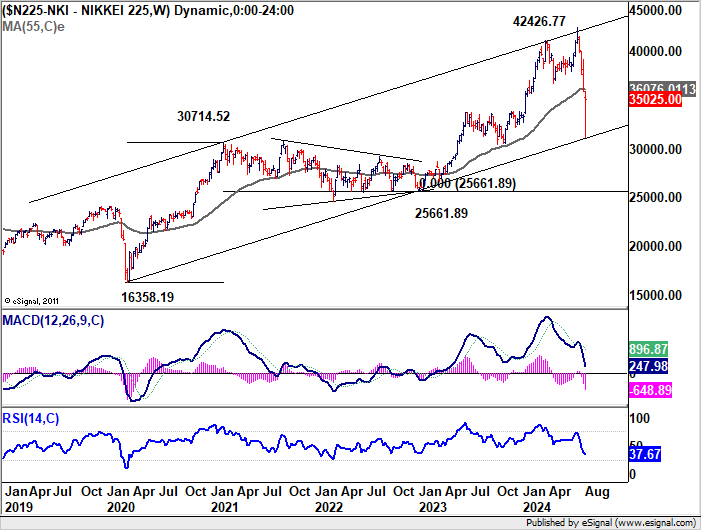
Japan was at the epicenter of the market turmoil globally. On Monday, Nikkei suffered a historic drop of -12.4%. However, the index managed to stabilize as the week progressed, even staging a strong rebound. Contributing to this recovery was BoJ Deputy Governor Shinichi Uchida, who helped soothe investor anxieties by downplaying the likelihood of an imminent rate hike. Uchida emphasized the necessity of keeping the current policy rate “for the time being,” citing the “extremely volatile” market environment.
Technically, however, Nikkei hasn’t even filled the gap left on Monday totally yet. The close below 55 W EMA is also a bearish sign. Risk remains on the downside for another fall. The key question is whether Nikkei could finally defend the long term channel support as seen in the weekly chart. Decisive break there will argue that fall from 42426.77 is a medium term down trend itself, rather than a corrective move. Nevertheless, break of 35880.14 gap resistance would at least bring stronger rebound for the near term.

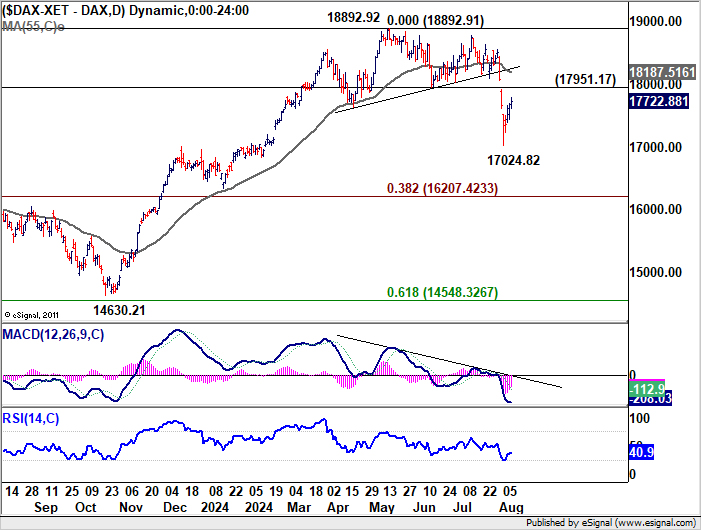
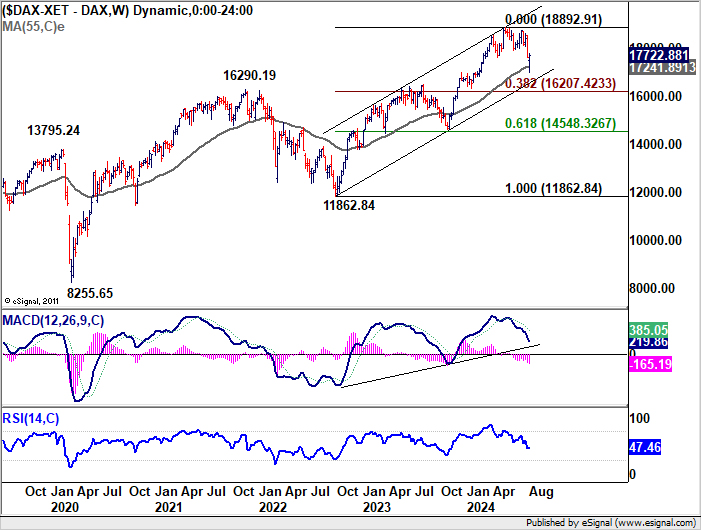
For DAX, on the one hand, a head and shoulder top was clearly formed, which is a bearish signal. On the other hand, the downside target could be considered matched with the dive to 17623.97, after hitting 55 W EMA (now at 17241.89). Still risk will stay on the downside as long as 17951.17 support turned resistance holds. The fall from 18892.92 could extend to long term channel support (now at around 16600), or even to 38.2% retracement of 11862.84 to 18892.91 at 16207.42 before completion. Nevertheless, firm break of 17951.17 will argue that the correction is already over.
CAD/JPY and AUD/JPY Rebounds From Key Fibonacci Levels, But Bearish Risks Persist
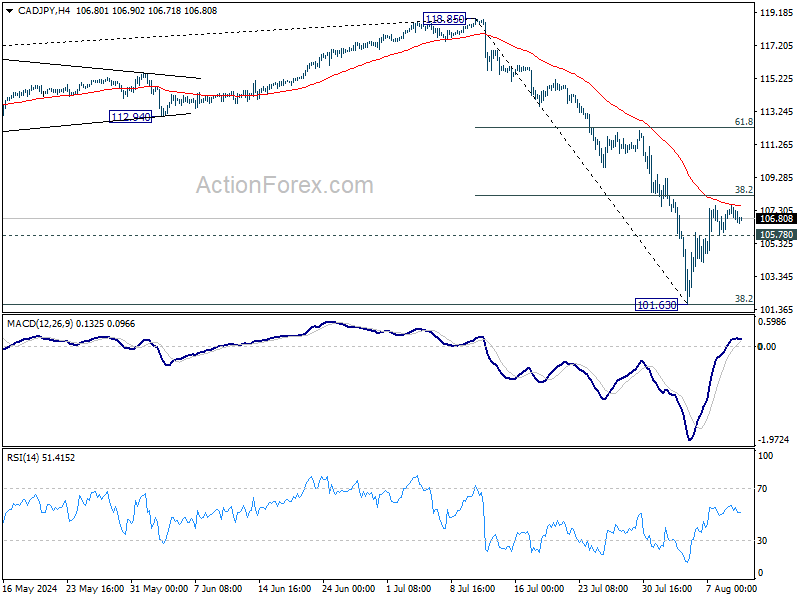
Both CAD/JPY and AUD/JPY rebounded strongly after initial dives, getting strong support from long term fibonacci levels. But price actions of since then have so far been corrective. Thus, risk will stay on the downside for now.
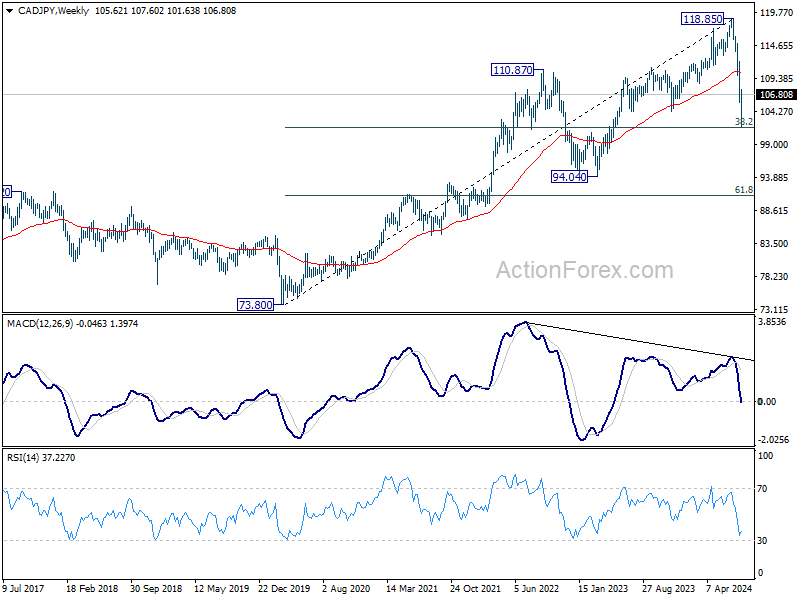
CAD/JPY recovered after falling to 101.63, after touching 38.2% retracement of 73.80 (2020 low) to 118.85 at 101.64. However, upside is capped by 55 4H EMA (now at 107.57) as well as 38.2% retracement of 118.85 to 101.63 at 108.20. Near term outlook will remain bearish for now. Break of 105.78 minor support will argue that the corrective recovery is completed and bring retest of 101.63, with prospect of resuming the whole fall from 118.85. Nevertheless, firm break of 108.20 will bring stronger rebound to 61.8% retracement at 112.27, even as an extended corrective rise.
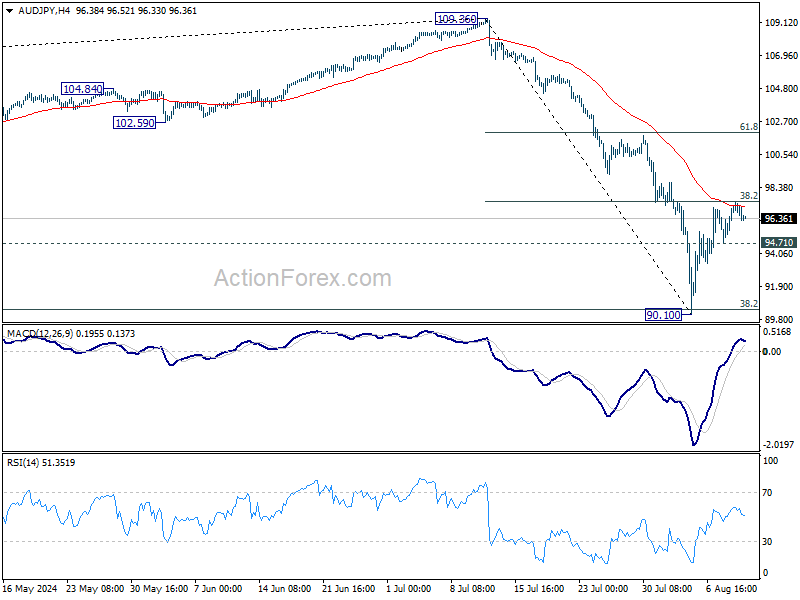
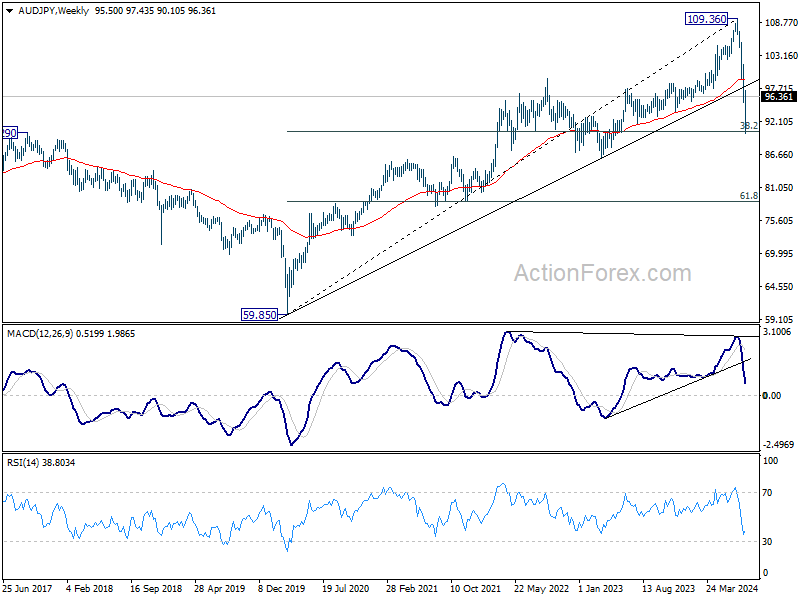
Similarly, AUD/JPY rebounded after hitting 90.01, breaching 38.2% retracement of 59.85 (2020 low) to 109.36 at 90.44. But upside is capped by 55 4H EMA (now at 97.10) as well as 38.2% retracement of 109.36 to 90.10 at 97.45. Near term outlook remains bearish for now. Break of 94.71 minor support will suggest that the recovery is finished and bring retest of 90.10, with risk of extending whole decline from 109.36. However, firm break of 94.5 will extend the rebound to 61.8% retracement at 102.22, even as an extended correcting rally.
EUR/CHF Weekly Outlook
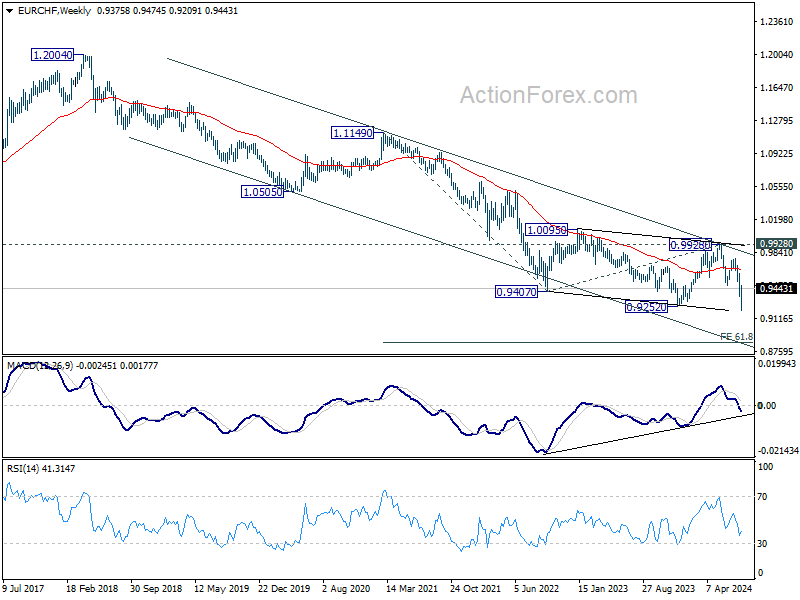
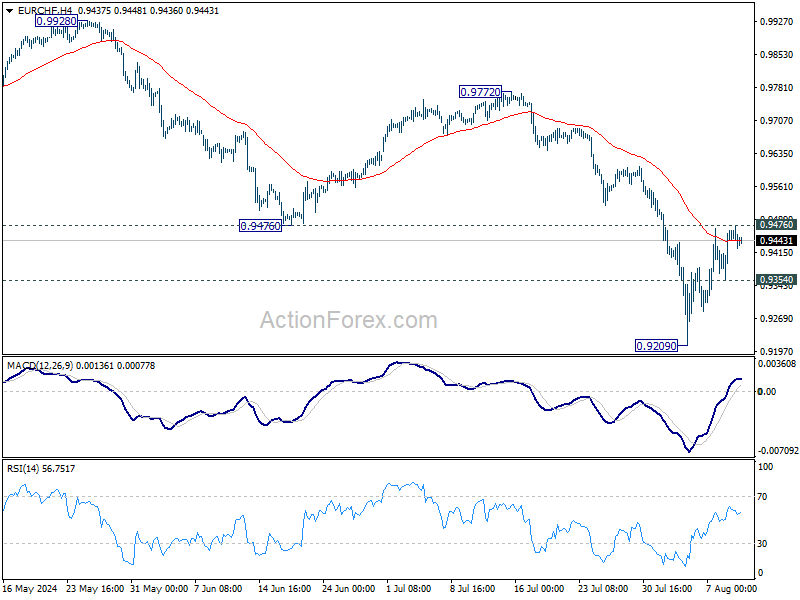
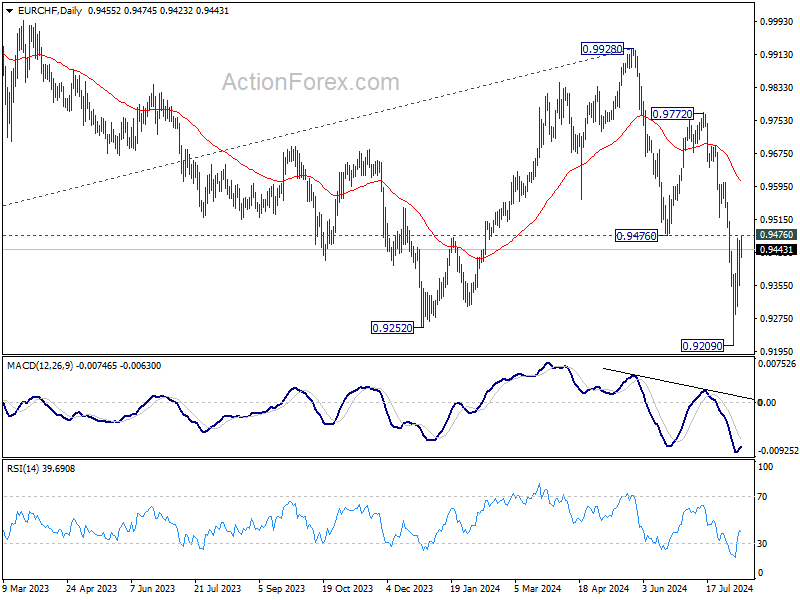
EUR/CHF rebounded strongly after initial dive to 0.9209 last week. But upside is limited by 0.9476 support turned resistance so far. Near term outlook remains bearish for now. On the downside, break of 0.9354 minor support will turn bias back to the downside for retesting 0.9209 low first. On the upside, however, sustained break of 0.9476 will turn bias to the upside for strong rise back to 55 D EMA (now at 0.9606).
In the bigger picture, medium term corrective pattern from 0.9407 (2022 low) might have completed with three waves to 0.9928. Decisive break of 0.9252 (2023 low) will confirm long term down trend resumption. Next target will be 61.8% projection of 1.1149 to 0.9407 from 0.9928 at 0.8851. For now, outlook will stay bearish as long as 0.9928 resistance holds, even in case of strong rebound.
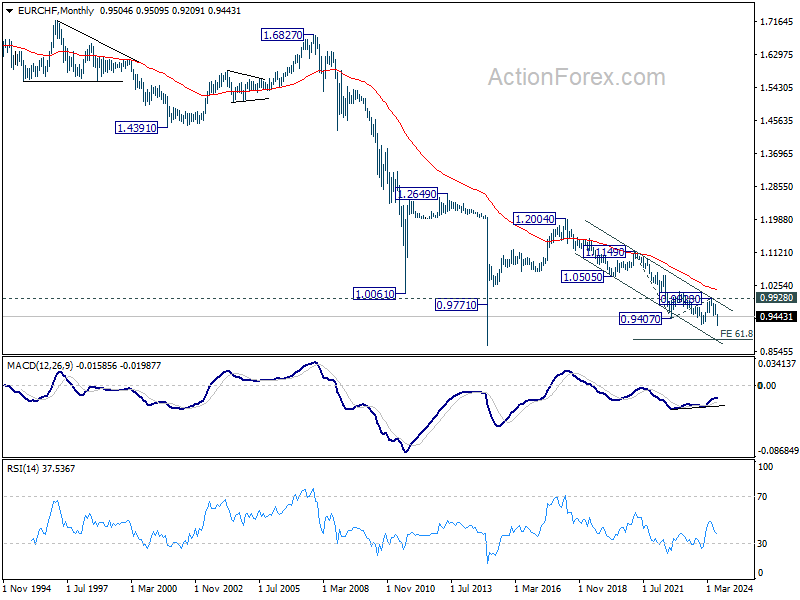
In the long term picture, fall from 1.2004 (2018 high) is part of the multi-decade down trend. Firm break of 0.9928 resistance is needed to be the first sign of long term bottoming. Otherwise, outlook will remain bearish.