Last week proved to be a whirlwind for global markets, marked by a series of shocking events—from the failed assassination attempt on Donald Trump last weekend, to the historic global tech outage that occurred on Friday that brought significant attention but surprisingly little reaction from the financial markets. Still, after a volatile week for stocks, questions are raised about whether the observed shift in risk sentiment is a temporary blip or the beginning of a more prolonged sluggish corrective phase that could color the upcoming months.
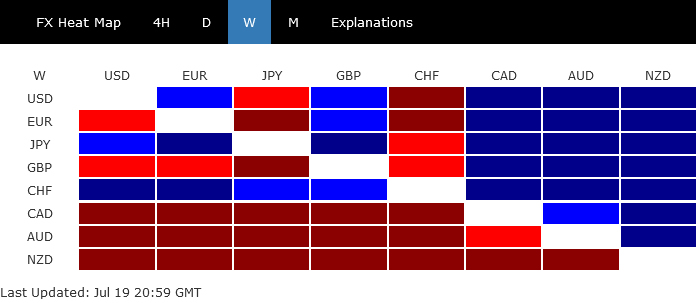
In the currency markets, the reaction was also pronounced, reflecting a clear picture of investor unease. Commodity currencies bore the brunt of this nervousness, with Kiwi leading the decline, followed by Aussie and then Loonie. Admittedly, Kiwi’s slide is particularly linked to anticipations of an earlier-than-expected rate cut by RBNZ, while Loonie is being pressured by another looming rate cut from BoC. Yet’s Aussie’s weakness across the board suggests that these currencies are significantly impacted by the prevailing risk-off mood.
Conversely, traditional safe-haven currencies like the Swiss Franc, Japanese Yen, and Dollar emerged as top performers, benefiting from the surge in risk aversion. Notably, Dollar managed a turnaround even amid strong market consensus around two impending Fed rate cuts this year, highlighting its dual role as a safe-haven asset and a currency influenced by domestic monetary policy expectations. Euro and Sterling, meanwhile, ended in the middle of currency performance rankings.
From Record Highs to Steep Pullbacks: Are US Markets Entering Pre-Election Cautious Phase?
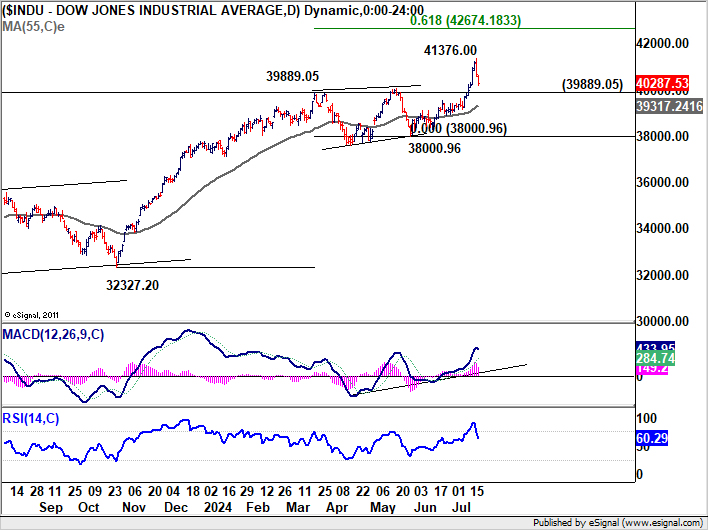
The US stock markets were on a rollercoaster ride last week, with pronounced volatility that caught many investors off guard. DOW epitomized this tumult, soaring to an all-time high of 41,376.00 before a stark reversal led it to close the week at 40,287.53, less than 300 pts above the previous week’s close. This pattern was mirrored in broader indices as well, with NASDAQ and S&P 500 suffering their most worst week since April.
Initially, market analysts pointed to sector rotation as the primary driver of these fluctuations. However, as the week progressed and even Russell 2000 also declined sharply towards the end of the week, it became evident that other factors were at play.
A deeper analysis suggests that investors are beginning to look beyond the anticipated rate cuts by Fed, with over 90% chance, as indicated by fed fund futures, of a cut in September and another in December. However, the positive impact of these expectations on the market seems to be waning. Instead, investors could have started to lock in gains from the robust rally since April, adopting a more cautious stance as the US presidential election looms on the horizon.
The presidential race is adding a layer of complexity to market sentiments. Donald Trump is clearly seen as the front runner, and speculation is rampant about shifts in the candidacy of the Democrats, on whether and when Joe Biden would quit, and who would be his replacement. Additionally, the implications of Trump’s policy directions, both domestically and internationally are still not totally clear.
Given that the election is more than three months away, it’s plausible that the markets may enter a protracted period of sluggish consolidation any time, reflecting the heightened uncertainty.
Looking ahead, the upcoming earnings season, which is going into full swing, will be a critical barometer to gauge that’s happening underneath. Notable sell-off in stocks after good earning results would indicate that profit-taking is already underway and could signal the start of a broader market consolidation.
Technically, some consolidations would be seen in DOW below 41376.00 in the near term. But outlook will stay bullish as long as 39889.05 resistance turned support holds. Another rally is expected to 61.8% projection of 32327.20 to 39889.05 from 38000.95 at 42674.18. Nevertheless, decisive break of 39889.05 would open up deeper correction to 55 D EMA (now at 39317.24), or even further to 38000.96 support.
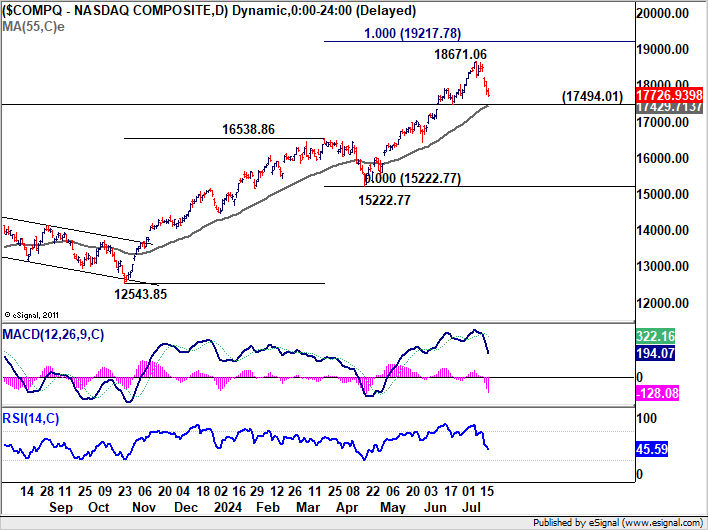
NASDAQ’s steep pullback last week confirmed short term topping at 18671.06. Consolidations should be relatively brief as long as 17494.01 support holds. Another rally is expected sooner rather than later, to extend the up trend to 100% projection of 12543.84 to 16538.86 from 15222.77 at 19217.78. However, firm break of 17494.01 and sustained trading below 55 D EMA (now at 17429.71) would argue that larger correction is underway. In this bearish case, deeper correction could be seen back to 15222.77/16538.86 support zone.
Vulnerability Also Seen Across Other Major Markets
The global stock markets were not performing well too, and are looking vulnerable.
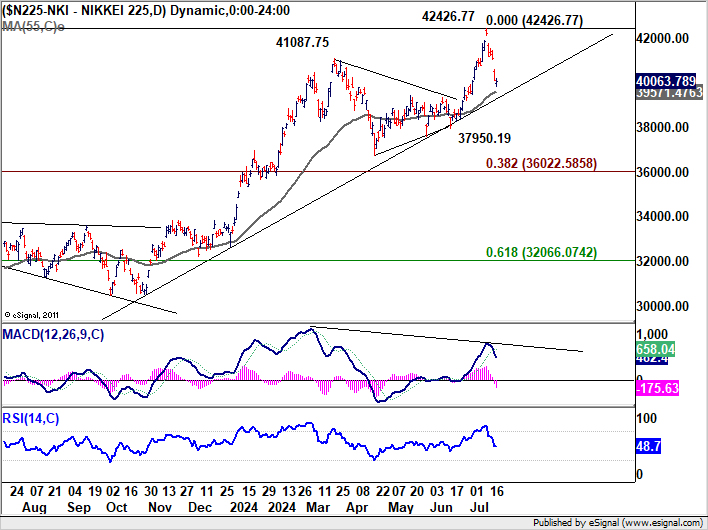
In Japan, Nikkei index plummeted from record high of 42,426.77, coinciding with the sharp rebound in Yen, which some market observers attribute to unconfirmed market intervention. Nevertheless, Near term outlook will stay bullish as long as 55 D EMA (now at 39571.47) holds. Strong bounce from current level will keep the long term up trend alive for another high above 42426.77 at a later stage.
However, considering that Nikkei was just rejected by long term rising channel resistance, sustained break of 55 D EA will argue that it’s already in larger scale correction. In this case, deeper fall would be seen to 38.2% retracement of 25661.89 to 4246.77 at 36022.58, which is close to 55 W EMA (now at 36065.32).
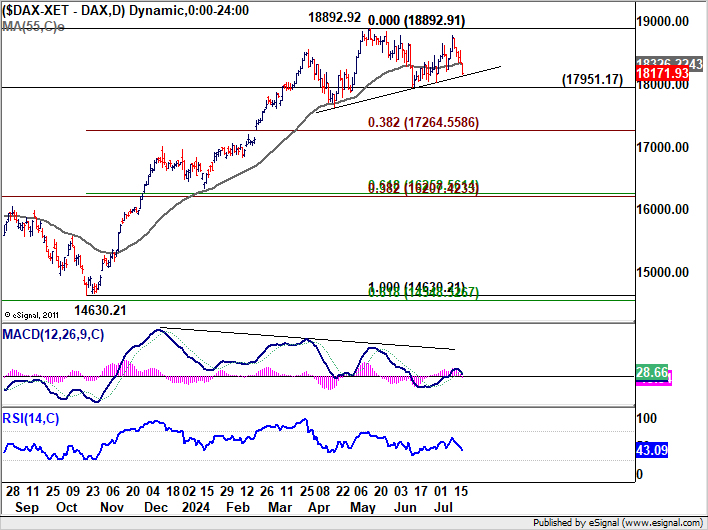
In Germany, DAX is now in the third leg of the corrective pattern from 18892.892 high. Strong support from 17951.17 will keep near term outlook neutral and for the base for another rally soon. However, decisive break of 17951.77 will complete a head and should top pattern, and bring deeper fall to 38.2% retracement of 14630.21 to 28892.92 at 17264.55.
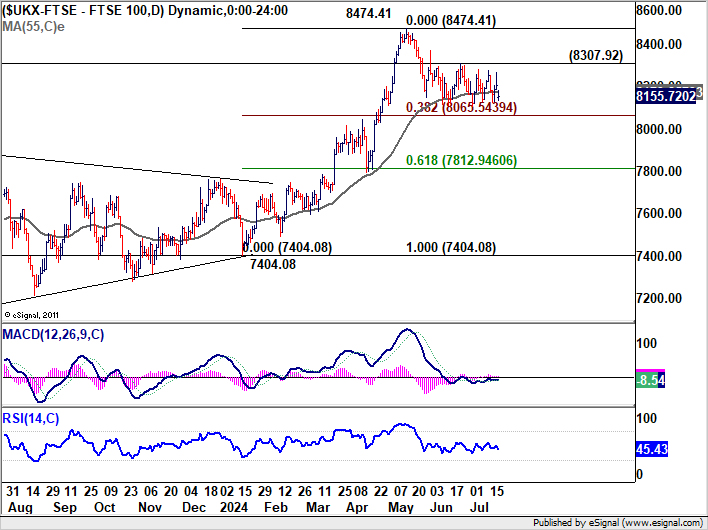
In the UK, the post election bounce has been very week, and capped below 8307.92 near term resistance. Break of 38.2% retracement of 7404.08 to 8474.41 at 8065.64 would bring deeper fall to 61.8% retracement at 7812.94, even just a correction to rise from 7404.08.
Dollar Index Finds Footing and Recovers on Shift in Risk Sentiment
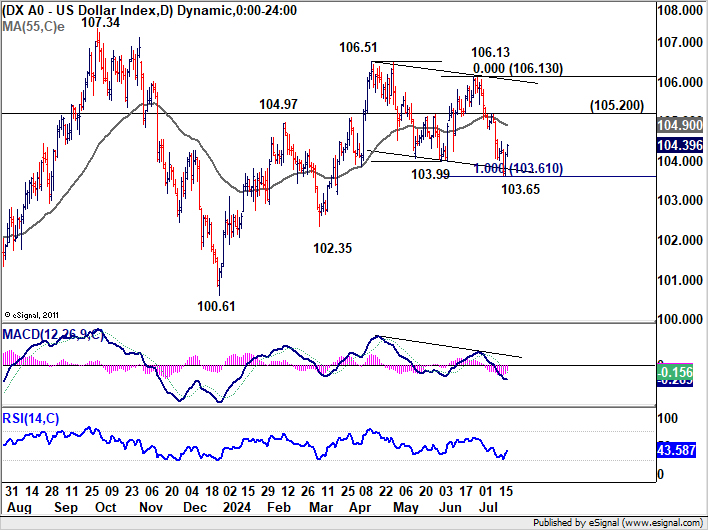
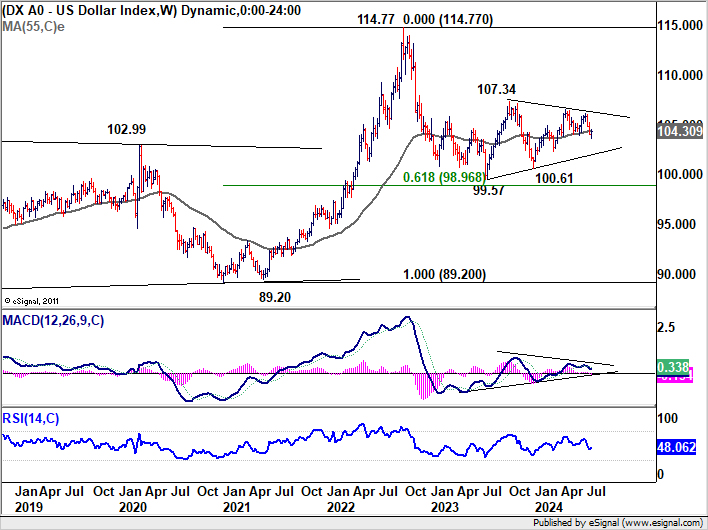
Dollar Index demonstrated some resilience last week. Despite briefly dipping to 103.65, it recovered to close the week higher at 104.39. This development provided some evidence against a full-blown bearish outlook for now, as the index found some support at 100% projection of 106.51 to 103.99 from 106.13 at 103.65. Additionally, DXY struggled to sustain below 55 W EMA (now at 104.30) totally.
The expectations of multiple Fed rate cuts this year, combined with an extended period of risk-on market sentiment, were initially seen as catalysts for a deeper selloff in Dollar Index. However, a shift in risk sentiment last week provided a floor for DXY. As the impact of Fed rate cut expectations began to wane, Dollar’s next is likely to be heavily influenced by the broader risk market dynamics.
Technically, further decline is still in favor in DXY as long as 105.20 resistance holds. Break of 103.65 and sustained trading below 55 W EMA will bring deeper fall to 102.35 or even further to 100.61.
However, break of 105.20 will argue that price actions from 106.51 is merely a corrective pattern that has completed with three waves to 103.65. Dollar index should then be ready to ready through 106.13/51 resistance zone to resume the rebound from 100.61.
Commodity Currencies Under Pressure
Commodity currencies faced significant headwinds last week, concluding as the weakest performers amidst a broader shift in risk sentiment, in particular in the US and Japan. There prospect of further selloff if the above mentioned bearish scenario in the global stock markets would materialize.
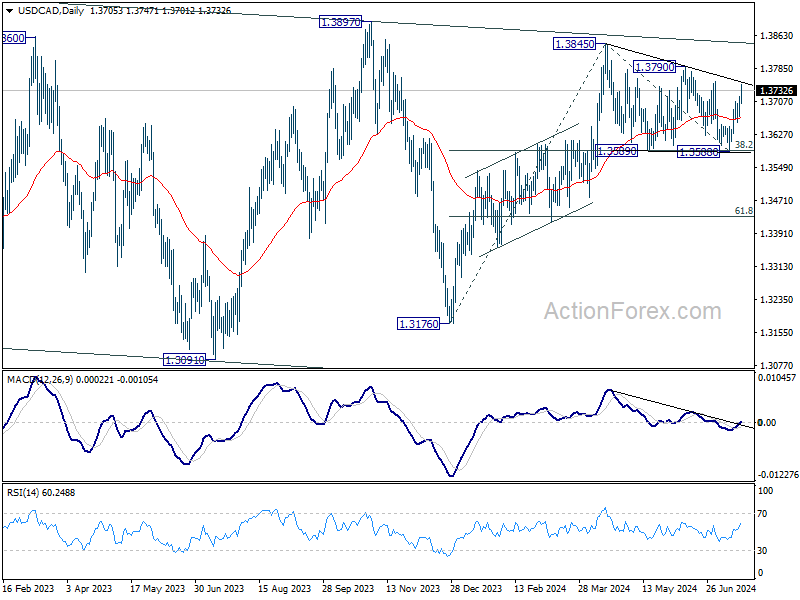
Technically, USD/CAD’s extended rally from 1.3588 argues that consolidation pattern from 1.3845 has completed in a three-wave format, after hitting 38.2% retracement of 1.3716 to 1.3845 at 1.3589. Near term focus is now on 1.3790 resistance. Decisive break there will suggest that rise from 1.3176 is ready to resume. Further break of 1.3845 will pave the way to 61.8% projection of 1.3176 to 1.3845 from 1.3588 at 1.4025.
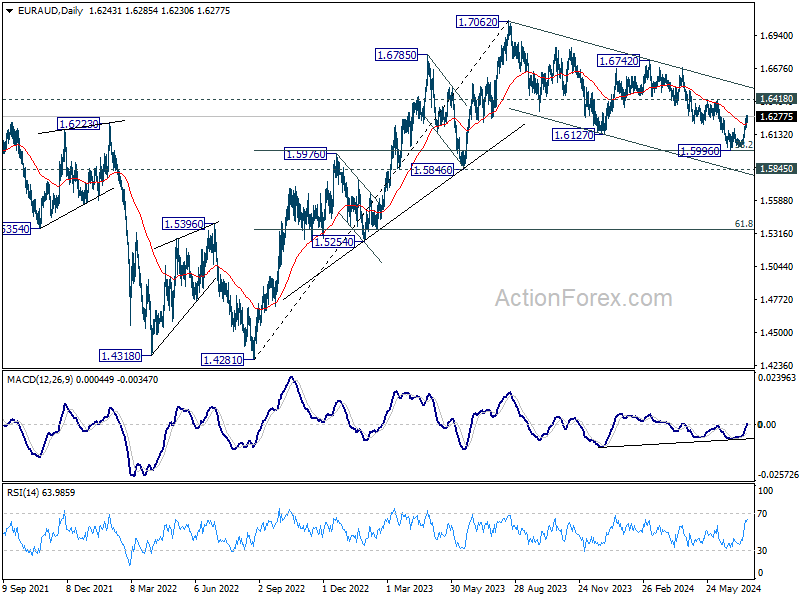
EUR/AUD break of 55 DEMA last week is taken as the first sign that correction from 1.7062 has completed with three waves down to 1.5996, after hitting 38.2% retracement of 1.4281 to 1.7062 at 1.6000. Near term focus is on 1.6418 resistance. Firm break there will solidify this bullish case and target 1.6742 resistance next.
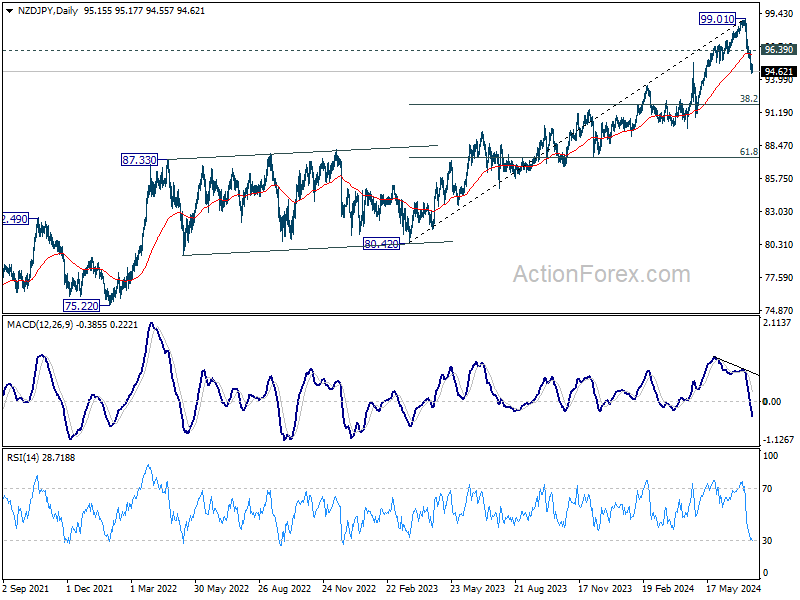
NZD/JPY’s extended decline and strong break of 55 D EMA argues that fall from 99.01 is already correcting the rally from 80.42. Further fall is expected as long as 96.39 resistance holds. Next target is 38.2% retracement of 80.42 to 99.01 at 91.90.
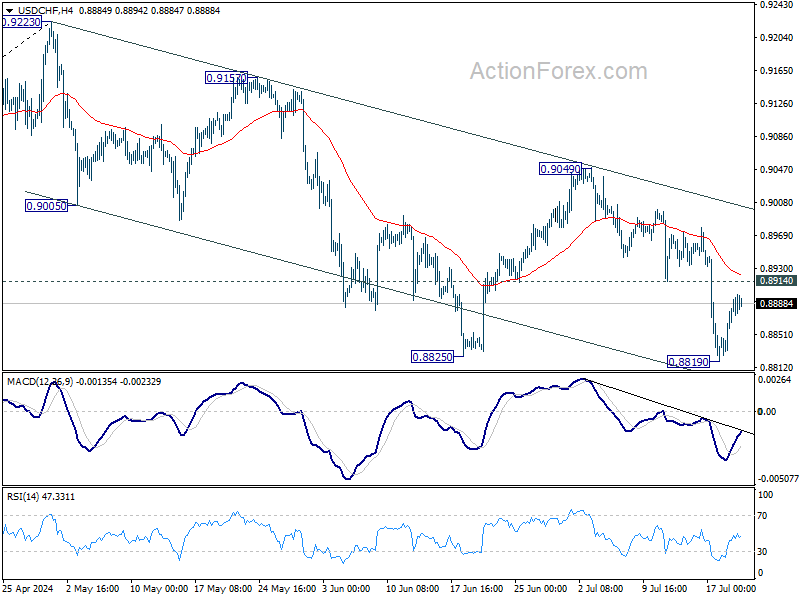
USD/CHF Weekly Outlook
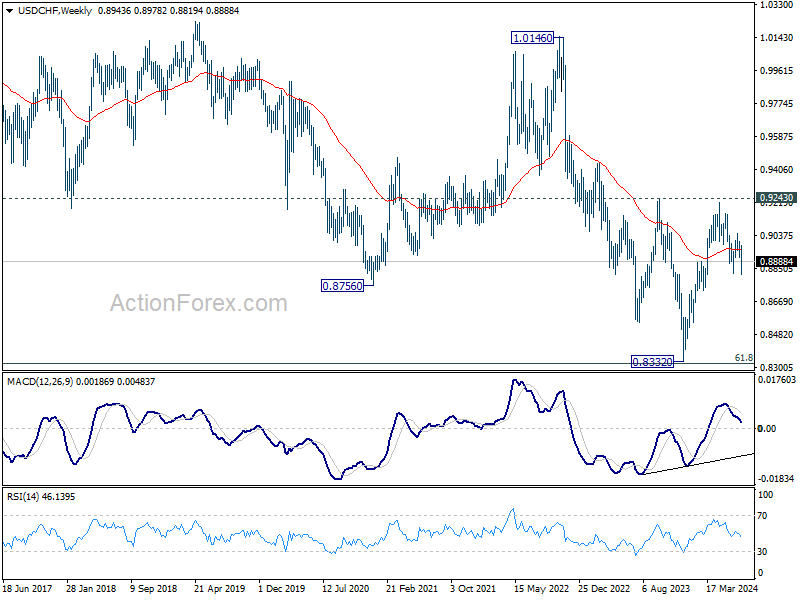
USD/CHF dipped to 0.8819 last week as fall from 0.9223 tried to resumed, but recovered since then. Initial bias remains neutral this week first. Further decline is in favor as long as 0.8914 support turned resistance holds. Break of 0.8819 will target 61.8% retracement of 0.8332 to 0.9223 at 0.8672 next. However, break of 0.8914 will turn bias back to the upside for stronger rebound instead.
In the bigger picture, with 0.9243 resistance intact, medium term outlook in USD/CHF is neutral at best. For now, more sideway trading is likely between 0.8332/9243. However, firm break of 0.9243 will indicate larger bullish trend reversal.
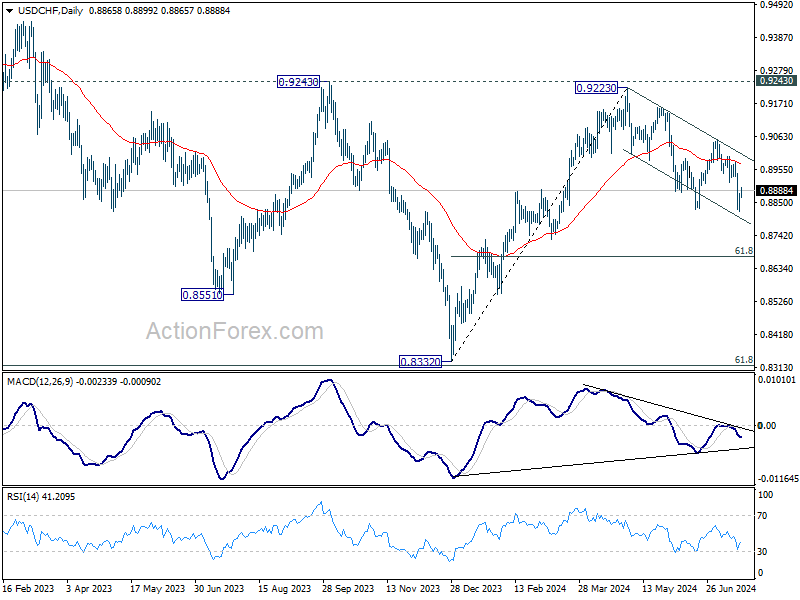
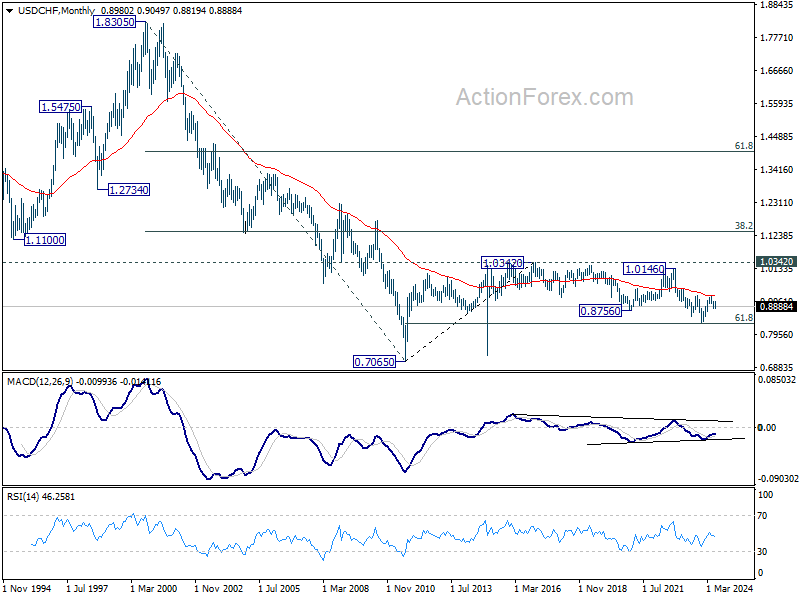
In the long term picture, price action from 0.7065 (2011 high) are seen as a corrective pattern to the multi-decade down trend from 1.8305 (2000 high). Strong rebound from 61.8% retracement of 0.7065 to 1.0342 (2016 high) at 0.8317 will start the third leg as a medium term rally. But there will be no sign of long term reversal until firm break of 38.2% retracement of 1.8305 to 0.7065 at 1.1359.