It was a week full of high profile events and much volatility was seen. But in the end, most forex pairs and crosses ended inside prior week’s range. Canadian Dollar closed as the second strongest, next to Kiwi, thanks to strong October job numbers. In addition, the Loonie was lifted further as WTI crude oil surged through 55.24 key resistance to resume the up trend that started back in February 2016. Sterling was the weakest one as markets responded negatively to the dovish BoE rate cut. But the pound is stubbornly holding on to key near term support against Dollar, Euro and Yen so far. Dollar ended the week mixed after all the events. FOMC delivered a forgettable statement, Jerome Powell was confirmed as President Donald Trump’s nomination as next Fed chair, House released the tax bill. Nonetheless, resilience of the greenback after non-farm payroll miss could be seen as hint of underlying strength. And Dollar could be back into driving seat soon.
US yield curve flattening
One of the most discussed topic last week as the flattening yield curve. The difference between 10 year yields and 2 year yields dropped to 74.58 basis points, hitting the lowest level since November 2007. The development was highly cited because flattening yield curve has historically been a reliable factor in predicting recessions. Some attributed the flattening to Powell, who is expected to carry on the policy path laid by Fed chair Janet Yellen. That is, Fed is still going to hike interest rates in December and three times next year, despite sluggish inflation. On the other hand, some attributed that to the prospect of tax reforms. Either the tax bills would find it too difficult to pass through all legislation to be enacted by December. Or, the eventual tax cuts won’t be as expansionary as economists expected.
But to us, the main reason for the pull back in 10 year yield was a decline in equivalent global yields. UK 10 year gilt yields dropped from Oct 25’s 1.404 to close on Nov 3’s 1.262, with downside acceleration after dovish BoE rate hike. 10 year German bund yields dropped from Oct 25’s 0.482 to Friday’s 0.364, with acceleration after ECB’s tapering "cautious" tapering announcement. It seems that markets are expecting less aggressive global policy tightening.
UK 10 year gilt yield (source: bloomberg)
German 10 year bund yield (source: bloomberg)
TNX in consolidation, but stays bullish
This is reflected in 10 year US yield too as TNX extended Oct 25’s high at 2.475 to close at 2.343 last week. Some consolidation would be seen in TNX in near term. But with 2.273 support intact, outlook remains bullish. And, we’re holding on to the view that medium term correction from 2.621 is completed at 2.034. We’d expect further rally ahead through 2.475 to retest 2.621 high, in near term.
US stocks made new record highs
Also, other than yields, the markets responded quite positively last week. DOW, S&P 500 and NASDAQ closed at record highs on Friday. DOW’s up trend accelerated again back in September and judging from weekly MACD and RSI, it’s still having solid momentum. It now looks like the index is finally gathering some more strength to break through 100% projection of 10404.49 (2011 low) to 18351.35 (2015 high) from 15450.56 (2016 low) at 23397.43. The coming weeks will be important to see if DOW could really sustain above this level. And, if so, next medium term target will be 161.8% projection at 28308.59.
Dollar index rebound sets to resume soon
Dollar index was also firm last week. Price actions from prior week’s high at 95.15 were clearly correctively. And rebound from 91.01 is still in progress. Friday’s post NFP rebound suggests that the index would likely takes out 95.15 to resume the rise this week. Next target will be 38.2% retracement of 103.82 to 91.01 at 95.90. As we mentioned in previous reports, the whole medium term fall from this year’s high at 103.82 has completed at 91.01 after drawing support from long term cluster at 91.91/93 (38.2% retracement of 72.69, 2011 low, to 103.82, 2016 high). As long as 93.47 support holds, we’re expecting further rally to 61.8% retracement at 98.92 and above.
Trading strategy
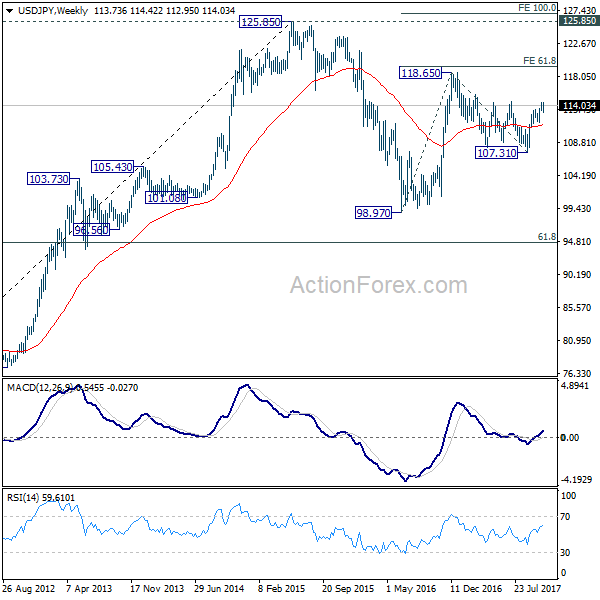
Based on the above analysis, we’d stay bullish in Dollar and would look for buying opportunities. We already have USD/JPY long (bought at 114.50). We’ll raise the stop from 112.50 to 112.80. As noted before, the medium term correction from 118.65 should have completed at 107.31. We’d expect a strong break of 114.49 key resistance to confirm this bullish view. 118.65 is the first target. We’ll look at the upside momentum on rally resumption to gauge the chance of hitting 2015 high at 125.85 at a later stage.
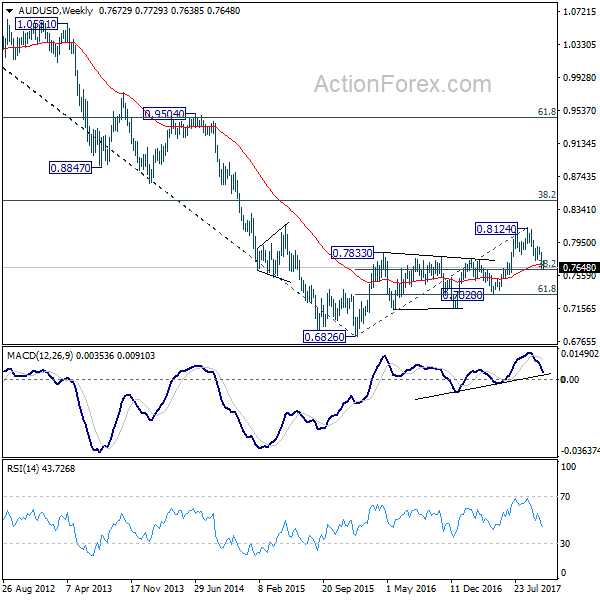
Meanwhile, we’ll sell AUD/USD on break of 0.7624 this week. In our view, the medium term rise from 0.6826 should have completed with three waves up to 0.8124. Going forward, first target is 0.7328 cluster support (61.8% retracement of 0.6826 to 0.8124). But we’ll also look at downside momentum to assess the chance of breaking through 0.6826 low to resume the long term down trend. Stop will be placed at 0.7735, slightly above last week’s high.
GBP/USD Weekly Outlook
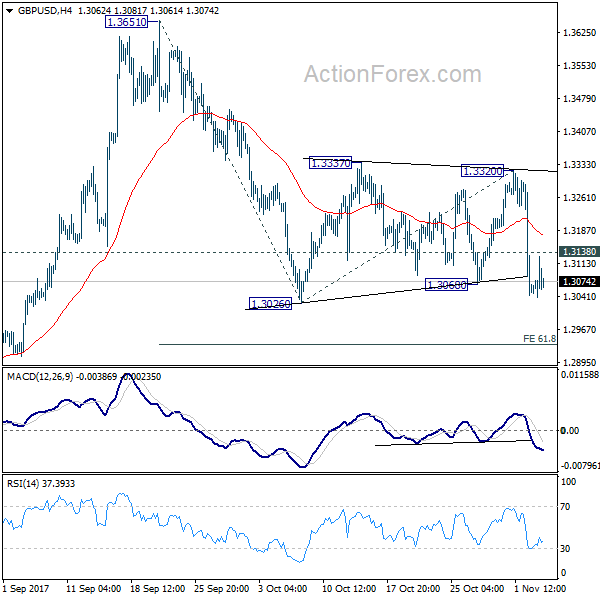
GBP/USD’s sharp decline last week argues that fall from 1.3651 might be resuming. Initial bias remains on the downside this week with focus on 1.3026 support. Break will confirm this bearish case and target 61.8% projection of 1.3651 to 1.3026 from 1.3320 at 1.2934 first. Break will bring deeper decline to 1.2773 key support level. On the upside, above 1.3138 minor resistance will extend the consolidation from 1.3026 with another rise.
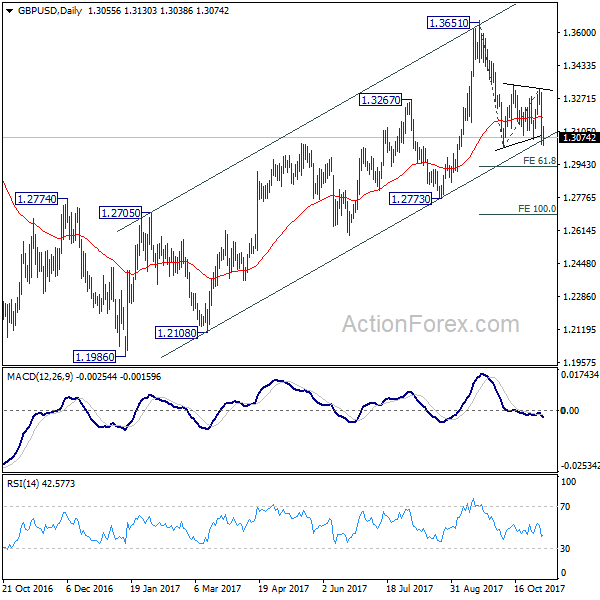
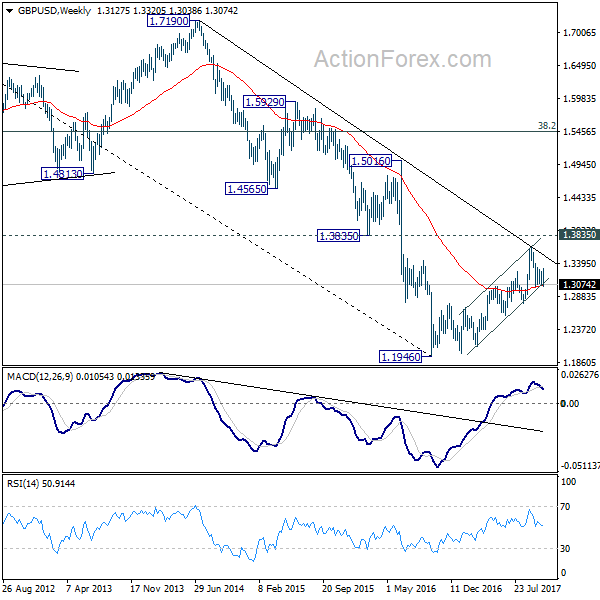
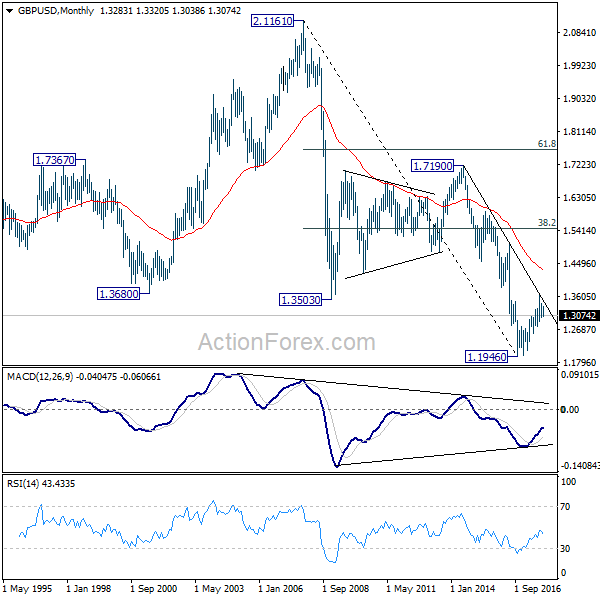
In the bigger picture, as noted before, GBP/USD hit strong resistance from the long term falling trend line. Current development is starting to favor that corrective rebound from 1.1946 low has completed at 1.3651. Decisive break of 1.2773 will confirm this bearish case and target a test on 1.1946 low next, with prospect of resuming the low term down trend. Nonetheless, break of 1.3320 resistance will restore the rise from 1.1946 for 38.2% retracement of 2.1161 (2007 high) to 1.1946 (2016 low) at 1.5466 .
In the longer term picture, long the outlook is turned a bit mixed as GBP/USD failed to break through falling tend line resistance. We’ll stay neutral first and assess the outlook again and price actions unfold.