
Dollar is showing mild strength in early US session despite slightly disappointing PCE inflation data. While the data reinforces the likelihood of a 25bps rate cut by the Fed in September, it does little to support the case for a more aggressive 50bps cut.
The greenback is getting a slightly boost from modest recovery in Treasury yields, which is also contributing to the slight weakness seen in Yen and Swiss Franc.
However, overall trading remains relatively subdued as in the final trading day of August. GDP data from Canada and CPI figures from Eurozone have largely been ignored by the markets.
For the week, New Zealand Dollar remains the strongest performer, followed by Canadian Dollar and Dollar. Meanwhile, Euro continues to lag as the worst, followed by Yen and Sterling. Swiss Franc and Australian Dollar are positioned in the middle of the performance chart.
In Europe, at the time of writing, FTSE is up 0.21%. DAX is up 0.18%. CAC is up 0.26%. UK 10-year yield is down -0.0331 at 3.960. Germany 10-year yield is down -0.007 at 2.275. Earlier in Asia, Nikkei rose 0.74%. Hong Kong HSI rose 1.14%. China Shanghai SSE rose 0.68%. Singapore Strait Times rose 1.13%. Japan 10-year JGB yield rose 0.0035 to 0.893.
US PCE core unchanged at 2.6% yoy, vs exp 2.7% yoy
US personal income rose 0.3% mom or USD 75.1B in July, above expectation of 0.2% mom. Spending rose 0.5% mom or USD 103.8b, matched expectations.
PCE price index rose 0.2% mom, while core PCE (excluding food and energy)rose 0.2% mom, both matched expectations. Prices for goods decreased by less than -0.1% and prices for services increased 0.2%. Food prices increased 0.2% and energy prices increased by less than 0.1%.
From the same month one year ago, PCE price index rose 2.5% yoy, unchanged from June’s reading, below expectation of 2.6% yoy Core PCE price index rose 2.6% yoy, unchanged from June’s reading, below expectation of 2.7% yoy. Prices for goods decreased by less than -0.1% and prices for services increased 3.7%. Food prices increased 1.4% and energy prices increased 1.9%
Canada’s GDP grows 0.5% qoq in Q2, flat in June
Canada’s economy posted growth of 0.5% qoq in Q2, slightly up from the 0.4% seen in Q1. This growth was driven by higher government consumption, increased business investment in engineering structures and machinery, and a rise in household spending on services. However, these gains were somewhat offset by declines in exports, residential construction, and household spending on goods. Notably, on a per capita basis, GDP declined by -0.1% in the second quarter, marking the fifth consecutive quarterly decline.
For June, GDP remained essentially flat, failing to meet expectations of a 0.1% mom increase. Goods-producing industries contracted by -0.4%, the largest decline since December 2023, with manufacturing and construction being the primary drags. In contrast, services-producing industries saw a modest 0.1% increase, continuing their growth streak for the third month in a row. Overall, 12 out of 20 sectors experienced expansion.
Advance information suggests that real GDP by industry remained unchanged in July. Declines in construction, mining, quarrying, and oil and gas extraction sectors were balanced by gains in finance, insurance, and retail trade, signaling a mixed economic outlook.
Eurozone CPI falls to 2.2%, core down to 2.8%, services up to 4.2%
Eurozone CPI slowed from 2.6% yoy to 2.2% in August. CPI core (ex-energy, food, alcohol & tobacco) ticked down from 2.9% yoy to 2.8% yoy. Both matched expectations.
Looking at the main components, services is expected to have the highest annual rate in August (4.2%, compared with 4.0% in July), followed by food, alcohol & tobacco (2.4%, compared with 2.3% in July), non-energy industrial goods (0.4%, compared with 0.7% in July) and energy (-3.0%, compared with 1.2% in July).
ECB’s Schnabel: Rate cuts can’t be mechanical amid stubborn domestic inflation
In a speech today, ECB Executive Board member Isabel Schnabel addressed the recent declines in inflation across parts of the Eurozone, describing them as “welcome developments.” However, she cautioned that the “current level of headline inflation understates the challenges monetary policy is still facing.”
Schnabel highlighted that domestic inflation remains elevated at 4.4%, driven largely by “persistent price pressures in the services sector,” where disinflation has stalled since last November. She pointed out that the continued high inflation momentum, particularly the annualized three-month-on-three-month change, indicates that services prices are still rising at a significant pace of almost 5%.
Schnabel noted that while incoming data broadly supports ECB’s baseline outlook, caution is needed as policy rates approach the upper band of the neutral rate, “the less certain we are how restrictive our policy is”
The pace of policy easing, she emphasized, “cannot be mechanical” and must be guided by data and analysis to ensure that monetary policy does not itself become a factor hindering disinflation.
Swiss KOF rises to 101.6, signaling hesitant economic recovery
Swiss KOF Economic Barometer edged up to 101.6 in August, slightly above expectations of 100.6, signaling a modest improvement in economic activity. The indicator remains just above its medium-term average, suggesting that Swiss economy is on what KOF describes as a “hesitant recovery path.”
The upward movement in the Barometer was driven primarily by gains in the other services sector, consumer demand, and construction industry. Additionally, the manufacturing and hospitality sectors saw modest improvements.
Meanwhile, the indicators for foreign demand remained nearly stable, while the financial and insurance services sector faced a slight decline.
Japan’s Tokyo inflation accelerates in Aug as production and retail sales miss estimates in Jul
Japan’s Tokyo CPI data for August shows further acceleration in inflation, with core inflation (excluding food) rising to 2.4% yoy, above the expected 2.2%. CPI core has been climbing steadily every month since hitting a bottom of 1.6% yoy in March.
Core-core CPI, which excludes both food and energy, also ticked up to 1.6% from 1.5%, while headline CPI surged to 2.6% from 2.2%.
These figures are often seen as a leading indicator for nationwide trends. Some economists noted that rise in prices growth was primarily driven by the phase-out of government subsidies on utility bills and a spike in rice prices. Underlying inflation trends may moderate in the coming months as these one-time factors dissipate.
Also released today, Japan’s industrial production rose by 2.8% mom in July, slightly below the expected 3.3%. Looking ahead, manufacturers surveyed by the Ministry of Economy, Trade, and Industry anticipate 2.2% increase in output for August, followed by -3.3% contraction in September.
Retail sales growth also slowed to 2.6% yoy in July, down from 3.7% in June, and below the expected 2.9%.
Additionally, the unemployment rate rose to 2.7% from 2.5%, surpassing expectations of it remaining steady at 2.5%. The jobs-to-applicants ratio, however, edged slightly higher to 1.24.
Australia’s retail sales stagnate in Jul as spending momentum stalls
Australia’s retail sales turnover for July showed no growth on a monthly basis, falling short of the expected 0.2% mom increase. This flat result comes after consecutive 0.5% mom increases in both June and May, driven by mid-year sales events.
According to Ben Dorber, head of retail statistics at the Australian Bureau of Statistics, “After rises in the past two months boosted by mid-year sales activity, the higher level of retail turnover was maintained in July.”
However, the detailed breakdown reveals a mixed picture across industries, with most sectors either seeing declines or remaining flat. The only industry to post an increase was food retailing, which managed a modest 0.2% rise.
EUR/USD Mid-Day Outlook
Daily Pivots: (S1) 1.1043; (P) 1.1091; (R1) 1.1127; More….
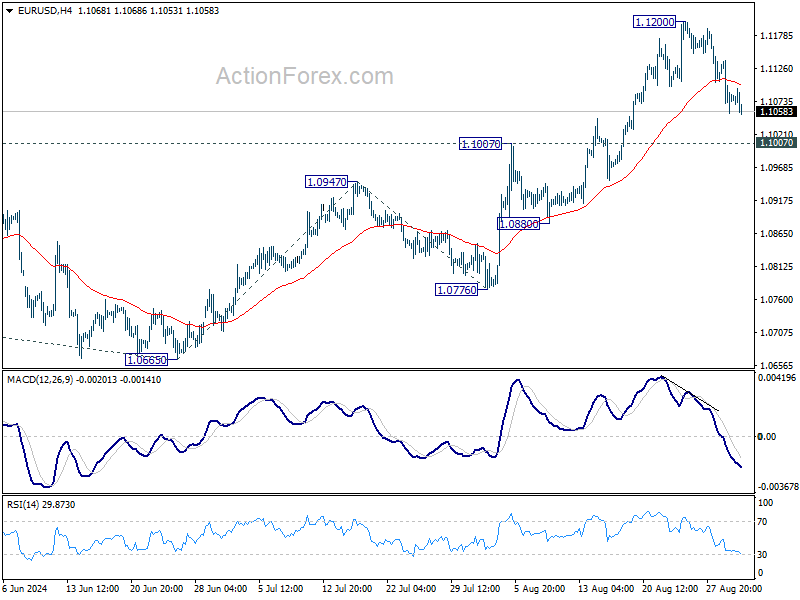
EUR/USD’s retreat continues to extend lower today, but downside is contained well above 1.1007 resistance turned support. Intraday bias remains neutral and larger rally is still expected to continue. On the upside, break of 1.1200 will resume recent rally to 161.8% projection of 1.0665 to 1.0947 from 1.0776 at 1.1232, and then 1.1274 high.
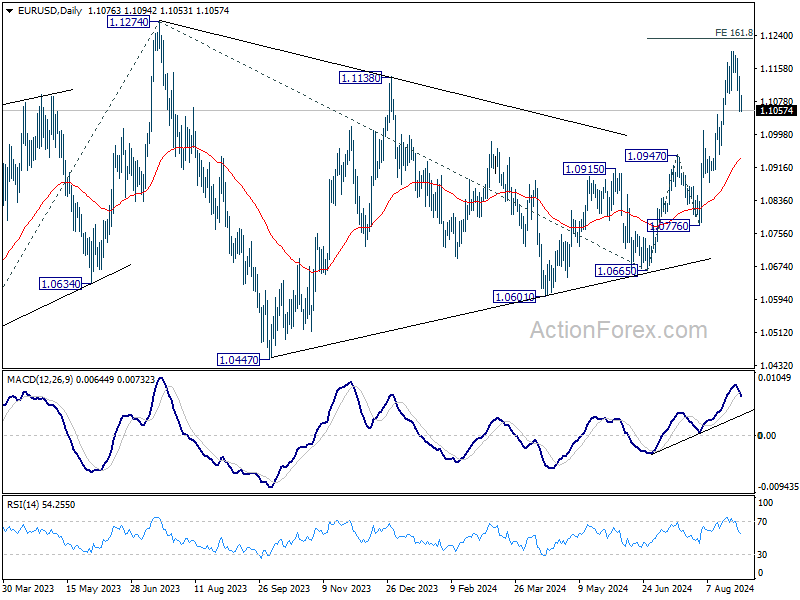
In the bigger picture, break of 1.1138 resistance indicates that corrective pattern from 1.1274 has completed at 1.0665 already. Decisive break of 1.1274 (2023 high) will confirm whole up trend from 0.9534 (2022 low). Next target will be 61.8% projection of 0.9534 to 1.1274 from 1.0665 at 1.1740. This will now be the favored case as long as 1.0947 resistance turned support holds.
Economic Indicators Update
| GMT | Ccy | Events | Actual | Forecast | Previous | Revised |
|---|---|---|---|---|---|---|
| 22:45 | NZD | Building Permits M/M Jul | 26.20% | -13.80% | -17.00% | |
| 23:30 | JPY | Tokyo CPI Y/Y Aug | 2.60% | 2.20% | ||
| 23:30 | JPY | Tokyo CPI core Y/Y Aug | 2.40% | 2.20% | 2.20% | |
| 23:30 | JPY | Tokyo CPI core-core Y/Y Aug | 1.60% | 1.50% | ||
| 23:30 | JPY | Unemployment Rate Jul | 2.70% | 2.50% | 2.50% | |
| 23:50 | JPY | Industrial Production M/M Jul P | 2.80% | 3.30% | -4.20% | |
| 23:50 | JPY | Retail Trade Y/Y Jul | 2.60% | 2.90% | 3.70% | |
| 01:30 | AUD | Retail Sales M/M Jul | 0.00% | 0.20% | 0.50% | |
| 01:30 | AUD | Private Sector Credit M/M Jul | 0.50% | 0.40% | 0.60% | |
| 05:00 | JPY | Housing Starts Y/Y Jul | -0.20% | -1.10% | -6.70% | |
| 06:00 | EUR | Germany Import Price Index M/M Jul | -0.40% | 0.00% | 0.40% | |
| 06:45 | EUR | France Consumer Spending M/M Jul | 0.60% | 0.60% | -0.50% | -0.60% |
| 06:45 | EUR | France GDP Q/Q Q2 | 0.20% | 0.30% | 0.30% | |
| 07:00 | CHF | KOF Leading Indicator Aug | 101.6 | 100.6 | 101 | |
| 07:55 | EUR | Germany Unemployment Change Aug | 2K | 16K | 18K | |
| 07:55 | EUR | Germany Unemployment Rate Aug | 6.00% | 6.00% | 6.00% | |
| 08:30 | GBP | Mortgage Approvals Jul | 62K | 61K | 60K | |
| 08:30 | GBP | M4 Money Supply M/M Jul | 0.30% | 0.50% | 0.50% | |
| 09:00 | EUR | CPI Y/Y Aug P | 2.20% | 2.20% | 2.60% | |
| 09:00 | EUR | CPI Core Y/Y Aug P | 2.80% | 2.80% | 2.90% | |
| 09:00 | EUR | Eurozone Unemployment Rate Jul | 6.40% | 6.50% | 6.50% | |
| 12:30 | CAD | GDP M/M Jun | 0.00% | 0.10% | 0.20% | 0.10% |
| 12:30 | USD | Personal Income M/M Jul | 0.30% | 0.20% | 0.20% | |
| 12:30 | USD | Personal Spending Jul | 0.50% | 0.50% | 0.30% | |
| 12:30 | USD | PCE Price Index M/M Jul | 0.20% | 0.20% | 0.10% | |
| 12:30 | USD | PCE Price Index Y/Y Jul | 2.50% | 2.60% | 2.50% | |
| 12:30 | USD | Core PCE Price Index M/M Jul | 0.20% | 0.20% | 0.20% | |
| 12:30 | USD | Core PCE Price Index Y/Y Jul | 2.60% | 2.70% | 2.60% | |
| 13:45 | USD | Chicago PMI Aug | 44.6 | 45.3 | ||
| 14:00 | USD | Michigan Consumer Sentiment Index Aug F | 67.8 | 67.8 |