Developments in the financial markets in the last 24 hours were rather mixed. Firstly, oil prices reversed after the announcement of extension of production cut from oil producers. WTI crude oil dropped to as low as 48.21, comparing to this week’s high at 52.00. Canadian Dollar followed lower but the sell off is limited so far. Secondly, US equities market strengthened overnight with S&P 500 gaining 0.44% to 2415.07. NASDAQ also rose 0.69% to close at 6205.26. Both indices made new record highs. DOW closed at 21082.95, 0.34%, inches below record high at 21169.11. US yields, on the other hand, stays soft with 10 year yield closed down -0.011 at 2.255. Gold is steady in range around 1250. Meanwhile, in the currency markets, Sterling plunged broadly after the downward revision in Q1 GDP released yesterday. Also, traders continue to lighten up positions as UK election in June approaches. Yen jumps broadly as Asian markets are in mild risk aversion. Dollar recovers but there is no sign of reversal yet as dollar index struggles below 97.50.
Impact of oil production cut limited
Here is what OPEC/non-OPEC has decided: The OPEC and the 11 non-members, including Russia, agreed to extend the output cut of 1.8M bpd further nine months, until March 2018. The decision had been widely anticipated. As Saudi Oil Minister Khalid Al-Falih noted, the producers have produced to "do whatever is necessary". He added that the decision to extend the deal for 9 months is to avoid a potential "seasonal build [of supply] in the first quarter [of 2018]" what could "undo what we’ve done". However, indications from OPEC/non-OPEC producers that they would extend production cut for 18 months had revived optimism over the past week. Oil prices, as a result, gained more than +8% over the past two weeks. Indeed, such rally had been overdone as the production cut implemented this January helped lift prices but also encouraged US producers to expand. The net positive impact, if any, in the demand/supply fundamental is limited.
St. Louis Fed Bullard: Inflation trend worrisome
In US, St. Louis Fed President James Bullard warned that the trend in US inflation since 2012 was "worrisome". He noted that US inflation is now 4.6% below the price level path established from 1995 to 2012. While it isn’t "as severe as the 1990s Japanese experience", it is worrisome. Meanwhile, he saw little impact on long term bond yields should Fed starts shrinking the balance sheet. San Francisco Fed President John Williams complained that "I had some hope or expectation that some of the fiscal or other federal policies would become more clear; that has not happened." And, the bigger question market now for the economy is on fiscal policy. Williams still penciled in "modest fiscal stimulus of some kind" in 2018 and 2019. Tax cuts should be more than enough to offset negative impacts of spending cuts.
On the data front…
Released in Asian session today, Japan national CPI core rose 0.3% yoy in April, up from 0.2% yoy but missed expectation of 0.4% yoy. Tokyo CPI core rose 0.1% yoy in May, up from -0.1% yoy and beat expectation of 0.0% yoy. Corporate service price index rose 0.7% yoy in April. US GDP revision, durable goods orders will be featured later in the day.
EUR/GBP Daily Outlook
Daily Pivots: (S1) 0.8642; (P) 0.8655; (R1) 0.8673; More…
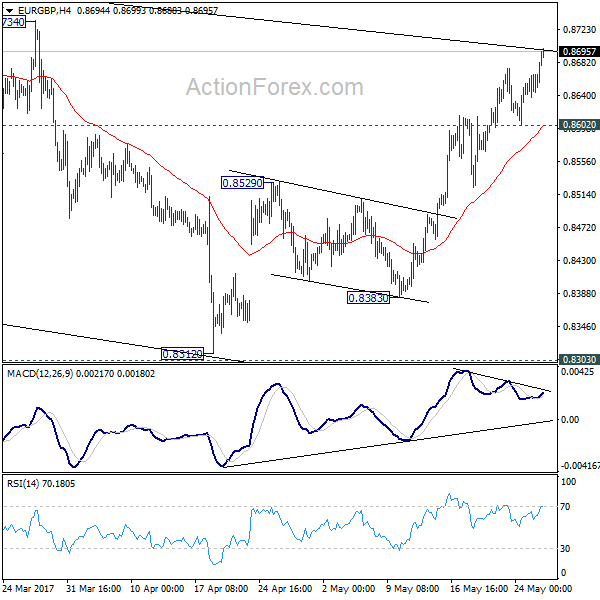
EUR/GBP’s rally resumed after brief consolidation and reaches as high as 0.8699 so far. Intraday bias is back on the upside and the rise from0.8312 should target 0.8786 resistance next. As noted before, price actions 0.9304 are viewed as a medium term corrective pattern that is extending. Break of 0.8786 would now pave the way to retest 0.9304 high. On the downside, below 0.8602 minor support will turn intraday bias neutral again. But near term outlook will remain mildly bullish as long as 0.8529 resistance turned support holds.
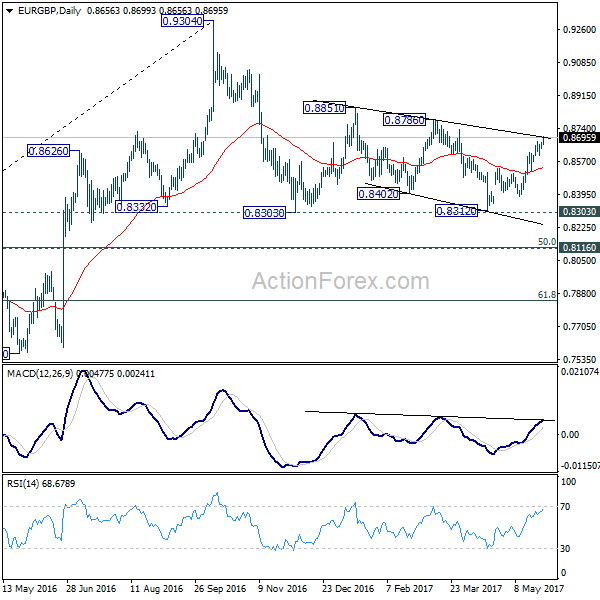
In the bigger picture, price actions from 0.9304 are viewed as a medium term corrective pattern. In case of deeper fall, we’d expect strong support from 0.8116 cluster support (50% retracement of 0.6935 to 0.9304 at 0.8120) to contain downside. Rise from 0.6935 (2015 low) will resume at a later stage to 0.9799 (2008 high). However, sustained break of 0.8116 could bring deeper decline to next key support level at 0.7564 before the correction completes.


Economic Indicators Update
| GMT | Ccy | Events | Actual | Forecast | Previous | Revised |
|---|---|---|---|---|---|---|
| 23:30 | JPY | National CPI Core Y/Y Apr | 0.30% | 0.40% | 0.20% | |
| 23:30 | JPY | Tokyo CPI Core Y/Y May | 0.10% | 0.00% | -0.10% | |
| 23:50 | JPY | Corporate Service Price Y/Y Apr | 0.70% | 0.90% | 0.80% | |
| 12:30 | USD | GDP (Annualized) Q1 S | 0.90% | 0.70% | ||
| 12:30 | USD | GDP Price Index Q1 S | 2.30% | 2.30% | ||
| 12:30 | USD | Durable Goods Orders Apr P | -1.50% | 0.90% | ||
| 12:30 | USD | Durables Ex Transportation Apr P | 0.40% | 0.00% | ||
| 14:00 | USD | U. of Michigan Confidence May F | 97.5 | 97.7 |
