The financial markets are rocked as US President Donald Trump’s political turmoil intensified. DOW dropped sharply by -372.82 pts, or -1.78% to close at 20606.93 overnight, the worst day since last September. S&P 500 lost -43.64 pts, or -1.82% to close at 2357.03. NASDAQ fell -158.63 pts, or -2.57% to close at 6011.24. Treasury yield also tumbled sharply with 10 year yield losing -0.113 to close at 2.216. Dollar is deeply and broadly sold off with the dollar index hitting as low as 97.33. Gold surges on Dollar weakness and breaches 1260 handle, comparing to last week’s low at 1214.3. In the currency markets, Swiss Franc and Japanese Yen are trading as the strongest major currencies for the week on safe haven flow. But Euro is not far behind as the third strongest one.
Trump’s Turmoil Worsens
Trump’s turmoil worsened after report of his intervention on FBI investigation of former national security advisor Michael Flynn. Several congressional panels are requesting testimony from former FBI Director James Comey, fired by Trump, on the issue. At the current moment, Republican politicians generally avoided direct response to the issue while House Speaker Paul Ryan said he has full confidence on the President. But there are already some Republicans calling for new investigative panels. The Justice Department has named former FBI Director Robert Mueller as the special counsel of oversee the investigation on Russia’s intervention of last year’s presidential election.
Markets reacted negatively to uncertainties
Markets are so uneasy with the development as it’s getting more doubtful on Trump to deliver his economic agenda. Much was priced in since last year’s election on expectation of the promised corporate tax cuts from 35% to 15% and USD 1T infrastructure spending. These policy actions would now be, at the very best, deferred. Meanwhile, uncertainties have spiked much higher, risking a dysfunctional government. Former Fed chair Ben Bernanke commented on the developments and said that "one of the reasons the markets are reacting is because there’s a lot of uncertainty. Things could break a lot of different ways here."
Starting to price out June hike odds
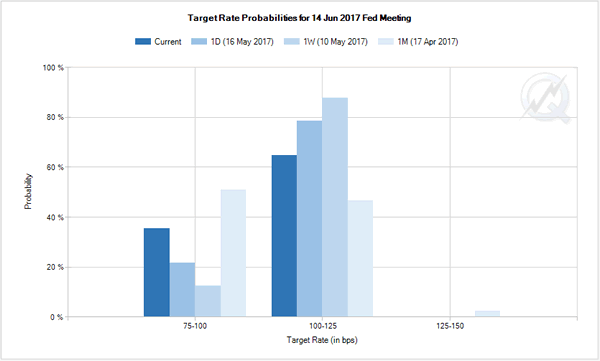
And the situation has worsen to a point that markets are starting even to price out the chance of a June Fed hike. Fed fund futures are now showing 64.6% chance of a June hike, down from 87.8% a week go.

Dollar index could be in medium term correction
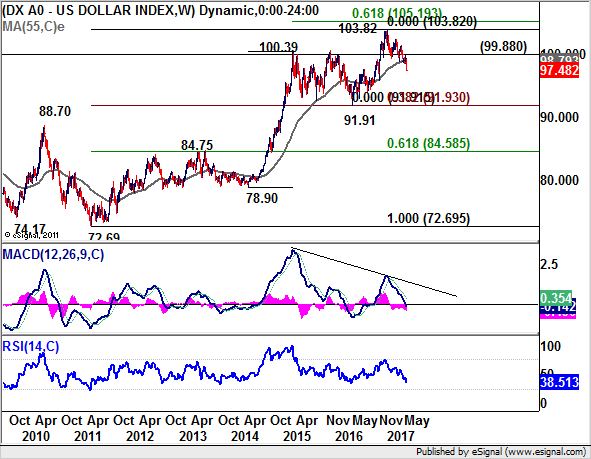
The change in market expectation is clearly reflected in the Dollar index too. Now with strong break of 55 week EMA, it’s raising the chance that 103.82 is a medium term top after failing 61.8% projection of 78.90 to 100.39 from 91.91 at 105.19. That is, the five wave sequence from 72.69 could be completed. The index will remain vulnerable as long as 99.88 resistance holds. And further downside acceleration will pull the index to 91.91 cluster support (38.2% retracement of 72.69 to 103.82 at 91.91) before having strong support for sustainable rebound.

Elsewhere…
Japan GDP rose 0.5% qoq in Q1, above expectation of 0.4% qoq. GDP deflator dropped -0.8% yoy, below expectation of -0.7% yoy. Australia employment grew 37.4k in April, above expectation of 5.0k. Unemployment rate dropped to 5.7%, below expectation of 5.9%. Consumer inflation expectation rose 4.0% in May. UK retail sales will be the main feature in European session. US will release jobless claims, Philly Fed survey and leading indicators.
USD/JPY Daily Outlook
Daily Pivots: (S1) 110.02; (P) 111.57; (R1) 112.37; More…
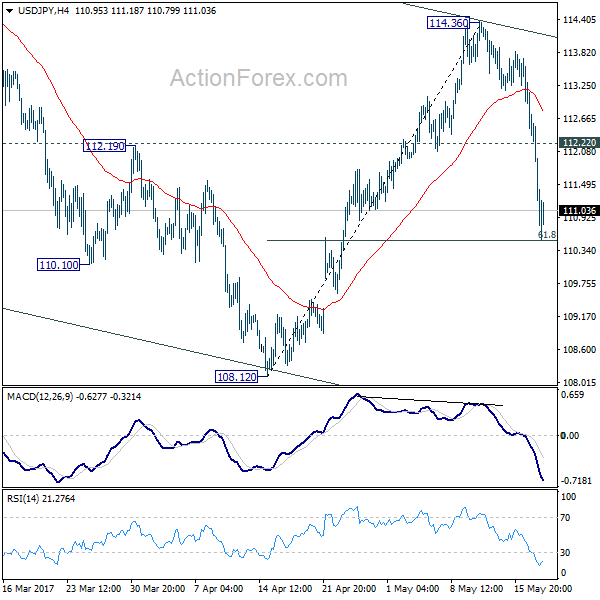
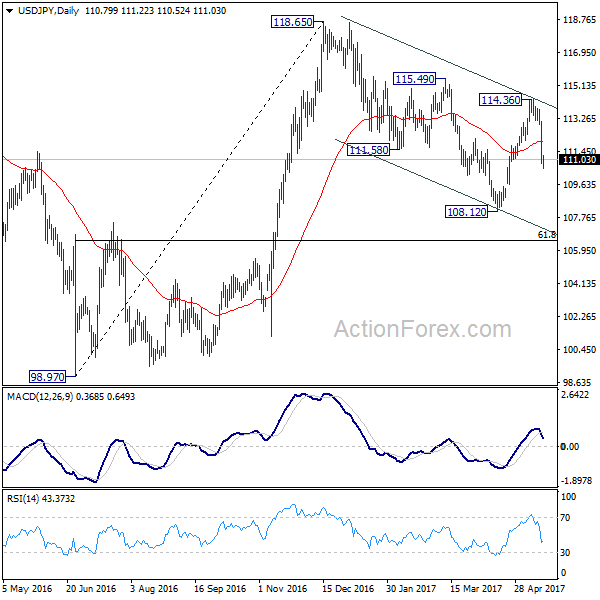
USD/JPY’s fall from 114.36 extends to as low as 110.52, and recovers mildly ahead of 61.8% retracement of 108.12 to 114.36 at 110.50. There is no clear sign of bottoming yet. Break of 110.50 will bring deeper fall to 108.12 low. In that case, the whole decline from 118.65 would likely extend through 108.12 to 61.8% retracement of 98.97 to 118.65 at 106.48. On the upside, break of 112.22 minor resistance is needed to indicate completion of the fall from 114.36. Otherwise, deeper fall is still expected even in case of recovery.
In the bigger picture, price actions from 125.85 high are seen as a corrective pattern. It’s uncertain whether it’s completed yet. But in case of another fall, downside should be contained by 61.8% retracement of 75.56 to 125.85 at 94.77 to bring rebound. Overall, rise from 75.56 is still expected to resume later after the correction from 125.85 completes.


Economic Indicators Update
| GMT | Ccy | Events | Actual | Forecast | Previous | Revised |
|---|---|---|---|---|---|---|
| 23:50 | JPY | GDP Q/Q Q1 P | 0.50% | 0.40% | 0.30% | |
| 23:50 | JPY | GDP Deflator Y/Y Q1 P | -0.80% | -0.70% | -0.10% | |
| 1:00 | AUD | Consumer Inflation Expectation May | 4.00% | 4.10% | ||
| 1:30 | AUD | Employment Change Apr | 37.4k | 5.0k | 60.9k | 60.0k |
| 1:30 | AUD | Unemployment Rate Apr | 5.70% | 5.90% | 5.90% | |
| 8:30 | GBP | Retail Sales M/M Apr | 1.10% | -1.80% | ||
| 12:30 | CAD | International Securities Transactions (CAD) Mar | 38.84B | |||
| 12:30 | USD | Initial Jobless Claims (MAY 13) | 240k | 236k | ||
| 12:30 | USD | Philly Fed Manufacturing Index May | 18.5 | 22 | ||
| 14:00 | USD | Leading Indicators Apr | 0.40% | 0.40% | ||
| 14:30 | USD | Natural Gas Storage | 45B |
