
EURUSD Outlook
EUR/USD Mid-Day Outlook
Daily Pivots: (S1) 1.1828; (P) 1.1877; (R1) 1.1921; More….
Intraday bias in EUR/USD stays neutral for the moment. On the upside, above 1.1928 will target a retest on 1.2081 high. Decisive break there and sustained trading above 1.2 psychological level will carry larger bullish implications. On the downside, however, sustained trading below 55 D EMA (now at 1.1752) will raise the chance of reversal on rejection by 1.2, and target 1.1576 support for confirmation.
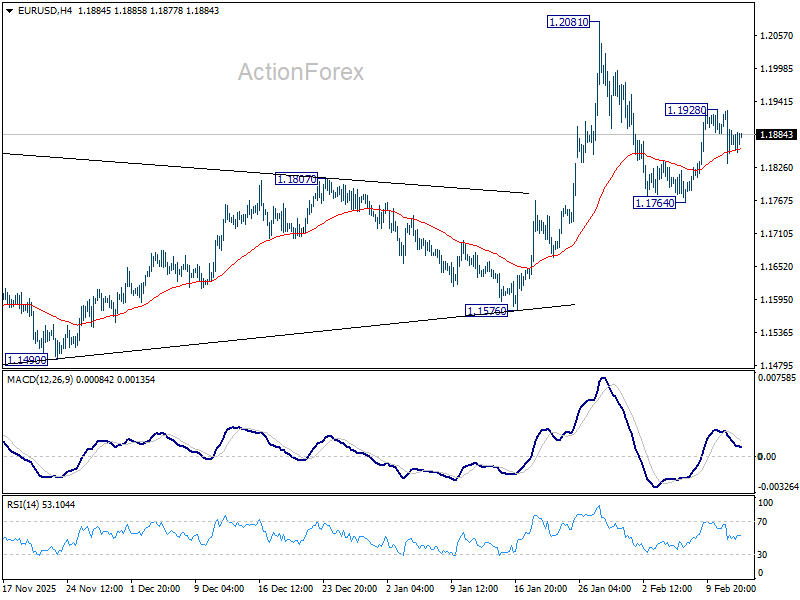
In the bigger picture, as long as 55 W EMA (now at 1.1470) holds, up trend from 0.9534 (2022 low) is still in favor to continue. Decisive break of 1.2 key psychological level will add to the case of long term bullish trend reversal. Next medium term target will be 138.2% projection of 0.9534 to 1.1274 from 1.0176 at 1.2581. However, sustained trading below 55 W EMA will argue that rise from 0.9534 has completed as a three wave corrective bounce, and keep long term outlook bearish.

EUR/USD Daily Outlook
Daily Pivots: (S1) 1.1828; (P) 1.1877; (R1) 1.1921; More….
Intraday bias in EUR/USD remains neutral at this point. On the upside, above 1.1928 will target a retest on 1.2081 high. Decisive break there and sustained trading above 1.2 psychological level will carry larger bullish implications. On the downside, however, sustained trading below 55 D EMA (now at 1.1752) will raise the chance of reversal on rejection by 1.2, and target 1.1576 support for confirmation.
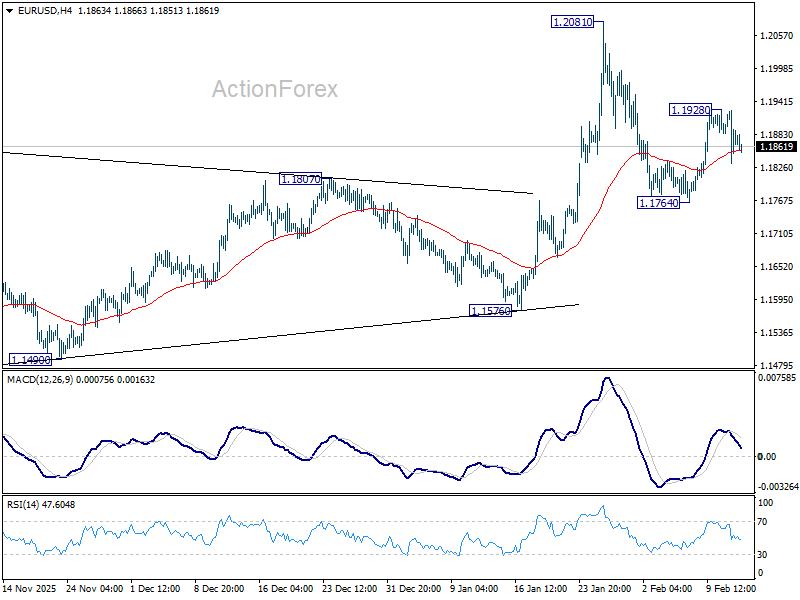
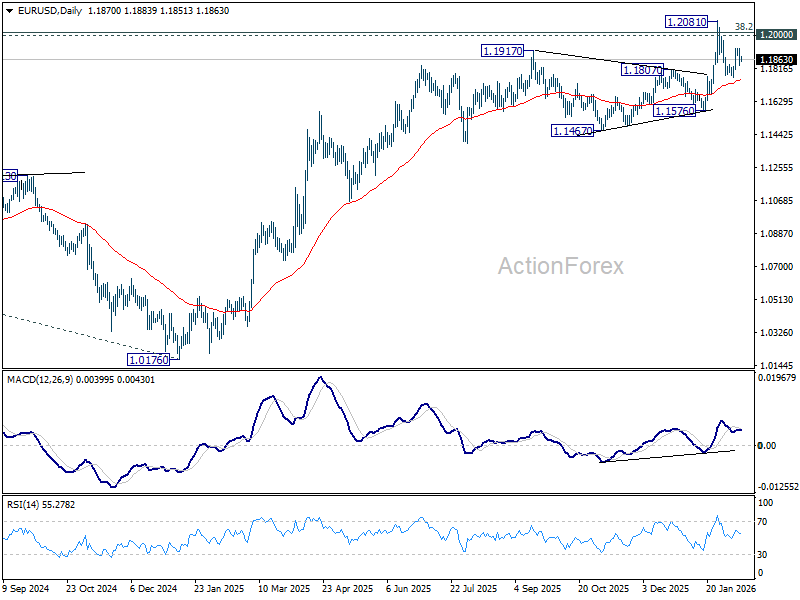
In the bigger picture, as long as 55 W EMA (now at 1.1470) holds, up trend from 0.9534 (2022 low) is still in favor to continue. Decisive break of 1.2 key psychological level will add to the case of long term bullish trend reversal. Next medium term target will be 138.2% projection of 0.9534 to 1.1274 from 1.0176 at 1.2581. However, sustained trading below 55 W EMA will argue that rise from 0.9534 has completed as a three wave corrective bounce, and keep long term outlook bearish.
EUR/USD Mid-Day Outlook
Daily Pivots: (S1) 1.1878; (P) 1.1904; (R1) 1.1920; More….
Intraday bias in EUR/USD is turned neutral with current retreat. On the upside, above 1.1928 will target a retest on 1.2081 high. Decisive break there and sustained trading above 1.2 psychological level will carry larger bullish implications. On the downside, however, sustained trading below 55 D EMA (now at 1.1749) will raise the chance of reversal on rejection by 1.2, and target 1.1576 support for confirmation.
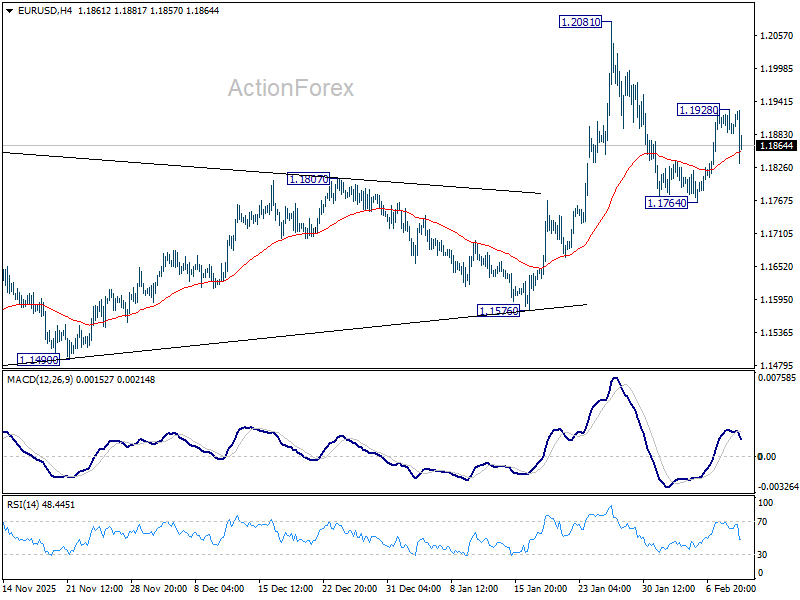
In the bigger picture, as long as 55 W EMA (now at 1.1470) holds, up trend from 0.9534 (2022 low) is still in favor to continue. Decisive break of 1.2 key psychological level will add to the case of long term bullish trend reversal. Next medium term target will be 138.2% projection of 0.9534 to 1.1274 from 1.0176 at 1.2581. However, sustained trading below 55 W EMA will argue that rise from 0.9534 has completed as a three wave corrective bounce, and keep long term outlook bearish.
