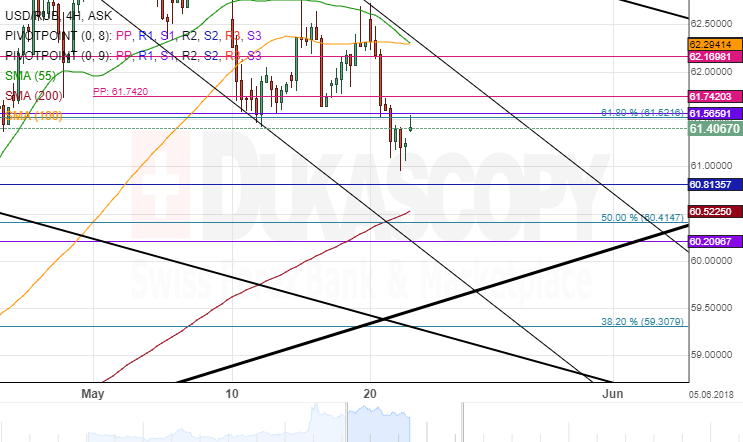
The USD/RUB pair has been more following simple channel trend lines than pivot points SMAs or Fibonacci retracement levels. Moreover, recently the 61.00 mark has been acting as a lone psychological level of significance.
In May the US Dollar began to lose value against the Russian Ruble. The decline has been occurring in a medium term descending channel pattern. This pattern is set to guide the rate down to the 60.00 level until June. However, on its way the rate will face various support levels, which can be observed on the chart.
Meanwhile, on Wednesday the pair was attempting to break past the major resistance levels near 61.50 level. If the rate fails to pass them, it is set to approach the 60.80 mark, where the closest support was located at.