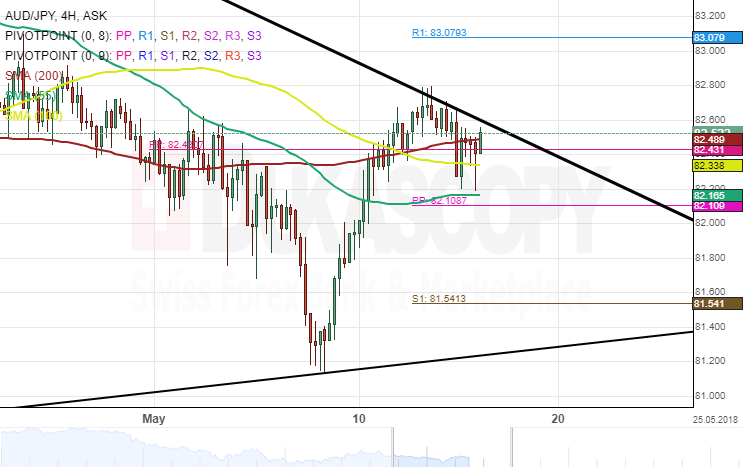
The Australian Dollar has been trading in a triangle-like formation during the past months. The currency pair tested the upper boundary of the aforementioned triangle pattern on May 14.
The exchange rate has moved closer to the up border of the downtrend line and a breakout could be expected within this session. Meanwhile, the rate was stranded between SMAs at the time of this analysis.
Everything being equal, the AUD/JPY currency exchange rate is likely to continue to gain strength during the following trading sessions. Nevertheless, technical indicators suggest a different scenario. On the weekly time-frame, it flashes strong sell signals.