, which could indicate a potential bullish reversal to test the previous tops (red line). A break below the previous bottom (green) would make a wave 4 (purple) pattern less likely.)
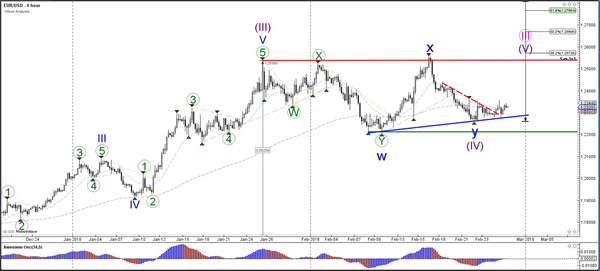
Currency pair EUR/USD
The EUR/USD has failed to break below the support trend line (blue), which could indicate a potential bullish reversal to test the previous tops (red line). A break below the previous bottom (green) would make a wave 4 (purple) pattern less likely.
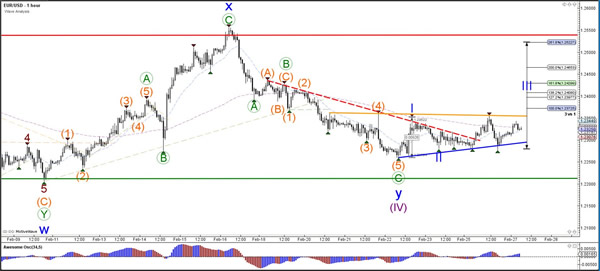
The EUR/USD needs to break above the resistance trend line (orange) fora bullish breakout towards the Fib targets of wave 3 (blue). A strong bearish turn at 1.2475-1.25 could indicate that price has built an ABC rather than a 123.
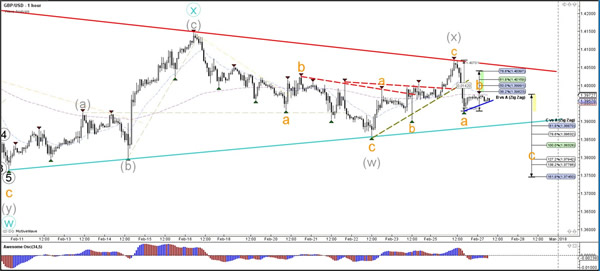
Currency pair GBP/USD
The GBP/USD failed to break above the resistance trend line (red) and remains in a triangle chart pattern. Price will need to break the S&R before a new trend becomes visible.
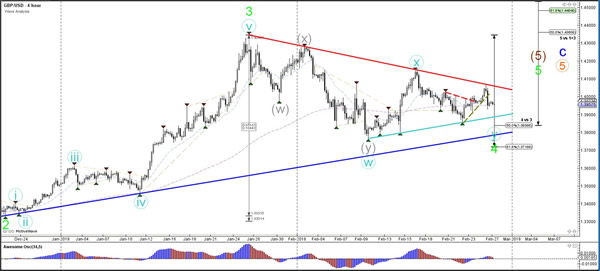
The GBP/USD is broke below the support trend line (dotted green) and could be building a bearish ABC (orange) zigzag within a larger WXY correction (grey) unless price manages to break above resistance (red).
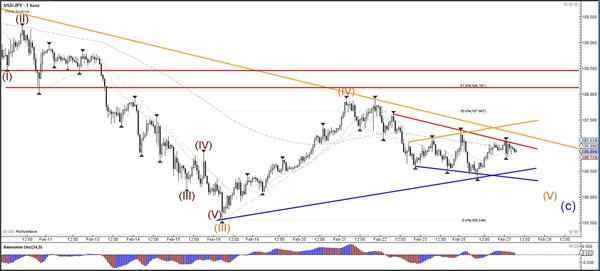
Currency pair USD/JPY
The USD/JPY could make one more lower low within wave 5 (green) if price manages to break below the support trend line (blue).
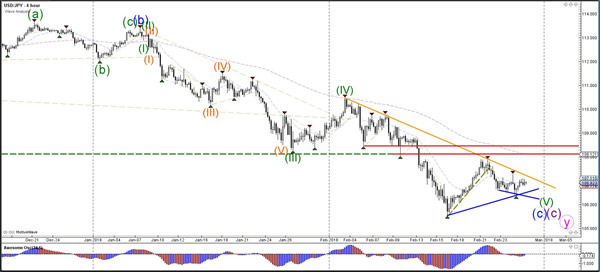
The USD/JPY bullish breakout would probably invalidate wave 4 (orange) whereas a bearish break could indicate a downtrend continuation.