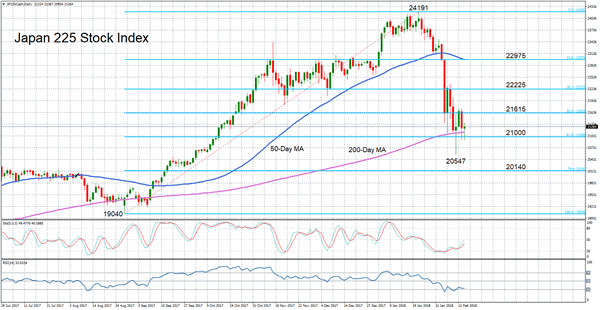
The Japan 225 stock index has suffered a sharp sell-off over the past three weeks, tumbling by around 15% from its 26-year high of 24191 on January 23 to a 4-month low of 20547 on February 9. The index appears to have found support around the 200-day moving average, with prices so far managing to close above it.
Momentum indicators are mixed with the RSI flat just above the 30 oversold level, suggesting that the next near-term trend could move in either direction. But the stochastics are pointing to some upside momentum, with both the %K and %D lines trending higher this week and approaching the 50 neutral level.
Immediate support can be found at the 21000 area but a continuation of the downslide could see the index targeting the 78.6% Fibonacci retracement level of the upleg from 19040 to 24191 as its next support around 20140. Deeper losses could open the way towards the August 2017 low of 19040.
However, should the weak upside momentum gather some further strength, the index could head higher before meeting resistance at the 50% Fibonacci level around 21615. A successful break above this level is needed for a stronger push up and to bring into scope the 38.2% and 23.6% Fibonacci levels at 22225 and 22975 respectively. The 23.6% Fibonacci is also where the 50-day moving average (MA) is currently converging at.
Looking at the medium-term picture, the index appears to be entering a bearish phase after prices reached the 200-day MA. However, with the 50-day MA still holding a large gap with the 200-day one, there is the possibility of a return to a bullish outlook if the current sell-off proves to be a correction and not a broader downtrend.

