. This could be a potential bounce spot if price does complete the wave 4 correction. A break above resistance (red/orange) could see the start of a wave 5 (purple).)
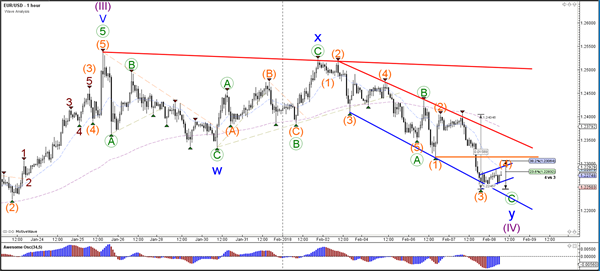
Currency pair EUR/USD
The EUR/USD continued to move lower within the bearish channel but price has now reached the 38.2% Fibonacci level of wave 4 (purple). This could be a potential bounce spot if price does complete the wave 4 correction. A break above resistance (red/orange) could see the start of a wave 5 (purple).

The EUR/USDfailed to break above resistance and in fact extended the bearish correction. The wave pattern however remains most likely an ABC (green) correction. Whether the wave C (green) is indeed completed depends if price can break above the potential bottom of wave 1 (orange), otherwise one more lower low as part of wave 4-5 (orange) could occur.
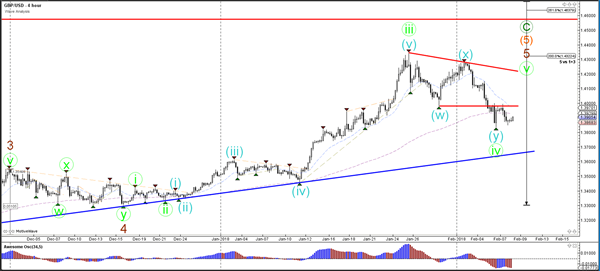
Currency pair GBP/USD
The GBP/USD could still be in a wave 4 (green) correction. A new bearish break would make this wave analysis unlikely and could indicate a potential larger bearish trend. A break above the previous top (red) could indicate a continuation rally.
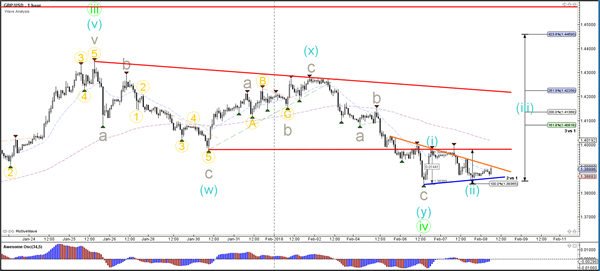
The GBP/USD did not invalidate the bottom of wave 2 (blue) and be building a wave 1-2 (blue) pattern.A break above resistance (red/orange) could indicate the start of wave 3 (blue).
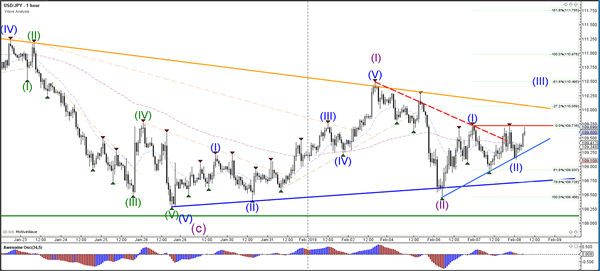
Currency pair USD/JPY
The USD/JPYis trapped in betweenstrong support (green/blue) and resistance (red/orange) but price still seems to be buildinga wave 1-2 (purple) pattern. A bearish break below the bottom and 100% Fib invalidates the wave 2 (purple).
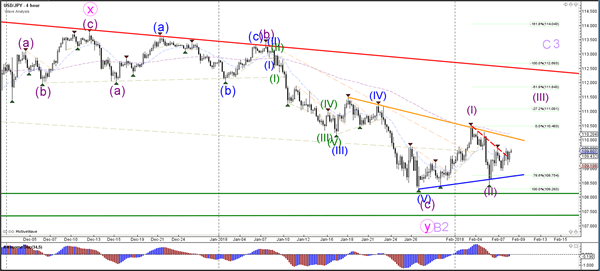
The USD/JPYneeds to break above resistance (red) before an uptrend continuation is likely.