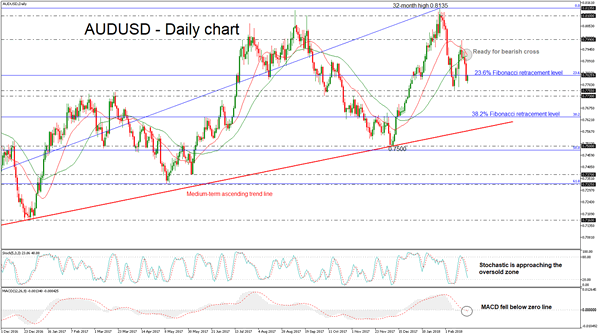
AUDUSD has reversed back down again after finding resistance at the 0.7990 resistance level achieved last week. Also, the price slipped below the 23.6% Fibonacci retracement level at 0.7826 of the up-leg with the low of 0.6820 and the high of 0.8100 in the medium-term timeframe during yesterday’s session.
The downside pressure seems to be stronger, while the technical indicators are endorsing the bearish scenario. From the technical point of view, in the short-term timeframe, the stochastic oscillator is approaching the oversold territory, while the MACD oscillator is moving slightly lower below the zero line. Additionally, the 20-day simple moving average is ready to post a bearish crossover with the 40-day SMA, indicating bearish pressure.
If the price remains below the 23.6% Fibonacci mark could, it could extend the losses towards the 0.7730 – 0.7755 support level. If the aforementioned area breached could open the way for the 38.2% Fibonacci level near 0.7635.
In the event of an upside movement, the next resistance to have in mind is the 0.7990 barrier. It is worth mentioning that AUDUSD has been developing within an ascending move since January 2016 and tested several times the diagonal line without slipping below it.

