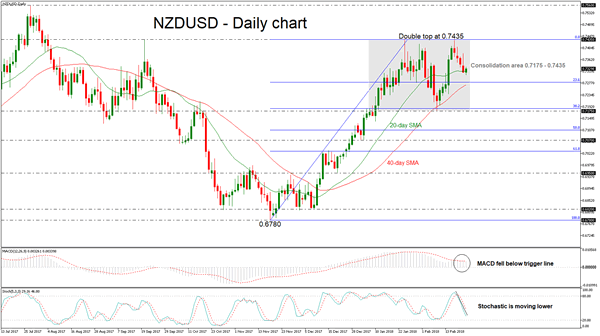
NZDUSD is trading lower over the last four days after it created a double top at the 5-month high of 0.7435 on February 16. The double top reversal is a bearish pattern indicating further losses on the price action. When looking at the bigger picture the pair lacks a clear trend since it has been consolidating within 0.7175 – 0.7435 after its rally from 0.6780 stalled at 0.7435.
In the 4-hour chart, momentum indicators are also pointing to a continuation of the bearish bias. The MACD oscillator is standing below the trigger line in the bullish zone, suggesting a further downward correction. Also, the stochastic oscillator is moving lower approaching the oversold zone after it posted a bearish cross within its moving averages.
If prices extend to the downside, immediate support could come from the 23.6% Fibonacci retracement level of 0.7270 of the upleg from 0.6820 to 0.7435. Below that, the price could hit the 0.7175 support, which is the 38.2% Fibonacci mark. An aggressive drop below the latter level could confirm the bearish pattern and open the door to the 50.0% Fibonacci level of 0.7100.
On the flip side, in the event of an upside reversal, the next level to watch is the aforementioned 5-month high obstacle. A break above this level could see a re-test of the 0.7560 high taken from the peak on July 27.

