Key Highlights
- Crude oil price found support around $58.00 after the last decline and recovered against the US dollar.
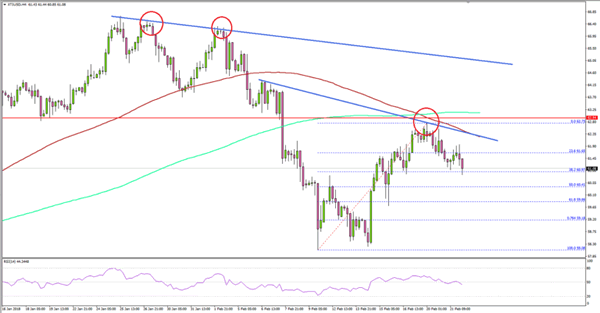
- There is a crucial resistance zone forming near $63.00 on the 4-hours chart of XTI/USD.
- The price needs to break the $63.00 resistance to gain upside momentum towards $65.00-66.00.
- The US Manufacturing PMI in Feb 2018 (Preliminary) increased to 55.9 from 55.5.
Crude Oil Price Technical Analysis
During the start of February 2018, there was a major decline in crude oil price against the US dollar. Later, the price found support near $58.00 and started a fresh upside move.

Looking at the 4-hours chart of XTI/USD, the price recovered above the $59.20 and $60.00 resistance levels. It even traded above the 50% Fibonacci retracement level of the last decline from the $66.30 high to $58.08 low.
However, the price is now facing an uphill task near the $63.00 level. The stated $63.00 is near the 200 simple moving average (green, 4-hours). An immediate resistance is around a bearish trend line at $62.40 on the same chart.
The trend line resistance at $62.40 is positioned with the 100 simple moving average (red, 4-hours). Therefore, it won’t be easy for buyers to break the $62.40-63.00 resistance region.
On the downside, an initial support is around the 50% Fib retracement level of the last wave from the $58.08 low to $62.75 high at $60.41. Below $60.40, the price could retest the $60.00 level.
US Manufacturing PMI and FOMC Meeting Minutes
Recently in the US, the FOMC meeting minutes were released. The minutes highlighted a strong growth in the US throughout 2018 and further rate hikes. The overall sentiment favored the greenback after the release, and pushed the US Dollar higher.
Moreover, the Manufacturing Purchasing Managers Index (PMI) for Feb 2018 (Preliminary) was released by the Markit Economics. The market was looking for a minor decline in the PMI from 55.5 to 55.4.
However, the actual reading was positive as there was an increase in the PMI from 55.5 to 55.9. Commenting on the report, the Chief Business Economist at IHS Markit, Chris Williamson, stated:
Business activity growth accelerated markedly in February, suggesting the economy is growing at its fastest pace for over two years. The upbeat February PMI surveys are indicative of GDP rising at an annualised rate of 3.0%.
In short, the market sentiment is positive and the US dollar could gain further momentum versus other major currencies such as the Euro, British Pound and the Japanese Yen.
USD/JPY recently recovered above the 107.00 level and is currently showing positive signs. On the other hand, EUR/USD broke a major support at 1.2380 and is currently trading in a bearish zone.
