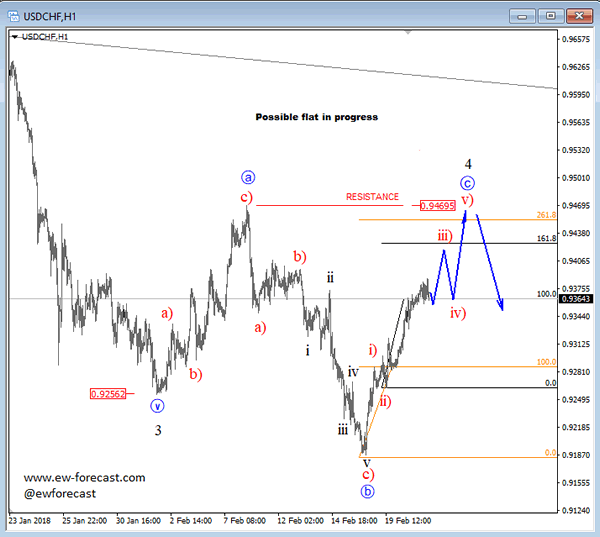
USDCHF can be making a bigger flat correction on the hourly chart, where we see a completed three-wave rally within first leg a, followed by a three-wave decline within wave b and now sharp bounce from recent lows near 0.9200 can suggest final blue leg c to be in progress. We know that in a flat pattern we have a structure of a 3-3-5, meaning final wave c always needs to unfolds five waves. Here we can see this nicely developing, but now we only see three waves to the upside with red minor wave iii) leading the way. That said price can rally up towards the 0.9467/0.947 region, where an ideal resistance region can be seen, and a new turn lower can show up.
USDCHF, 1H

