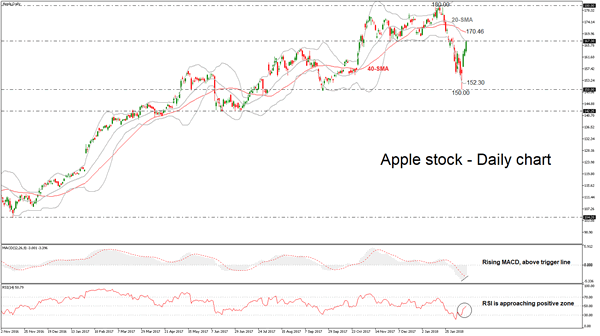
Apple stock price reached a 2-week high of 167.41 during Wednesday’s US session as the price extends its bullish run, following the rebound on the 150.00 critical psychological level. Also, the stock completed the third straight green day hitting the 20-day simple moving average, which overlaps with the current 167.30 resistance level.
In the daily timeframe, from the technical point of view, technical indicators are endorsing the scenario for further gains. The MACD oscillator is rising in the negative territory above its trigger line with strong momentum, while the RSI indicator is touching the 50 level after the aggressive run from the 30 area.
To the upside, there is an obstacle of 40-day SMA near 170.46, where the price needs to surpass it before moves towards the 180.00 handle, taken from the high on January 18.
Should prices reverse lower, immediate support could come at 152.30, which is the lower Bollinger band. A drop below this area could take the stock closer to the 150.00 key level and significantly weaken the bullish short-term structure.

