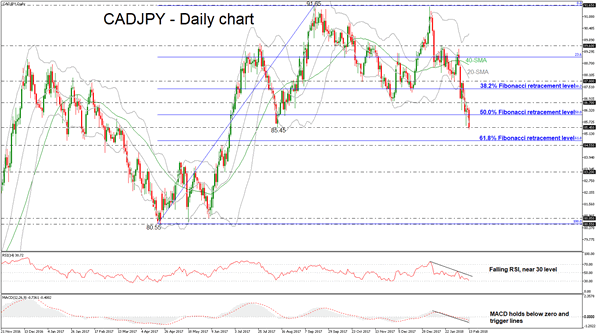
CADJPY has plummeted aggressively today as it posted a fresh an almost 8-month low of 85.37. The pair has been underperforming breaking below the 50.0% Fibonacci retracement level near 86.00 of the up-leg with the low of 80.55 and the high of 91.65. The short-term technical indicators are bearish and point to more weakness in the market.
Having a look at the daily timeframe, the momentum indicators are holding in the negative territory. The MACD oscillator slipped below its trigger line in the bearish area, while the RSI indicator is pointing to the downside in the negative territory. Moreover, the price has fallen below the Bollinger Band, signaling bearish tendency.
If price action drops below the 85.45 barrier, it could open the way for the next immediate support of 61.8% Fibonacci mark of 84.78. Clearing this key level would see additional losses towards the 84.55 support obstacle.
Upsides moves are likely to find resistance at the 86.70 barrier. Rising above this area would help to endorse the focus to the upside towards the 38.2% Fibonacci level of 87.40 and 87.80.

