U.S. Highlights
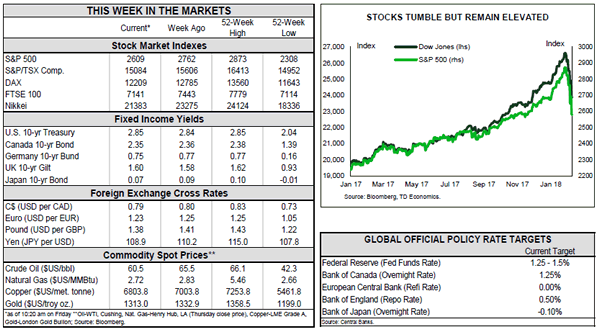
- Major U.S. stock indices entered correction territory on Thursday but remain elevated relative to where they were a year ago. The sell-off was spurred by fears of higher interest rates, as the 10-year government bond yield hit a four-year high.
- The $300 billion increase in the spending cap over two years, laid out in the federal budget deal, could add to inflationary pressures at a time when the economy is already operating at close to full capacity, pressuring yields up further.
- Next week, investors will turn their attention to hard data, with advanced January retail sales providing an indication of whether or not first quarter growth will be affected by the residual seasonality.
Canadian Highlights
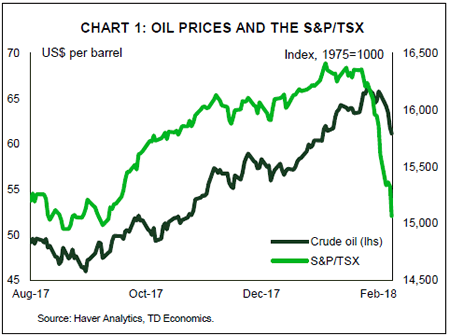
- It was a sea of red in Canadian financial markets this week, with the S&P TSX, oil prices and the Canadian dollar all losing ground.
- Canada’s trade deficit widened in December, suggesting that net trade will be a drag on growth in the fourth quarter.
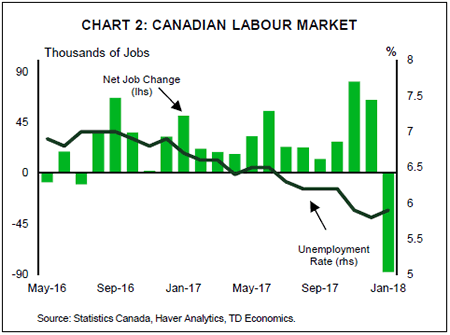
- Employment started the year off on a soft note, shedding 88k jobs in January. Losses were concentrated in part-time positions. The unemployment rate ticked up a point to 5.9%.
- Housing starts topped 200k units for an 8th straight month in January, despite some unfavourable weather conditions.
U.S. – Stocks Correct but Fundamentals Remain Solid
Major U.S. stock indices entered correction territory on Thursday but remain elevated relative to where they were a year ago. Despite falling about 10% from highs reached in the final days of January, the S&P 500, Dow Jones Industrial Average and the NASDAQ Composite remain 13-20% higher on a year-on-year basis. The sell-off was likely spurred by fears of higher real interest rates, as last week’s strong January jobs report showed robust wage growth, lifting both market expectations for inflation and fed rate hikes. At 2.85%, the ten-year government bond yield hit a four-year high this week.
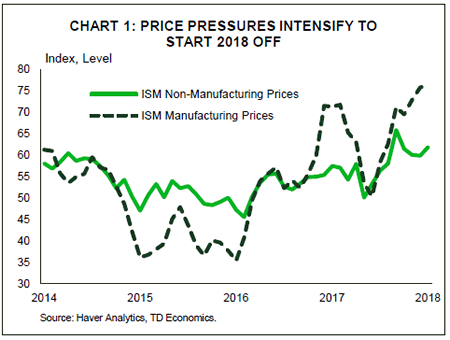
What’s important to note is that this sell-off was not triggered by weak economic data either for the U.S. or global economy. Indeed, we learned this week that the ISM non-manufacturing index showed an improvement in the services sector at the start of 2018, with rising price pressures mirroring its manufacturing counterpart (Chart 1).
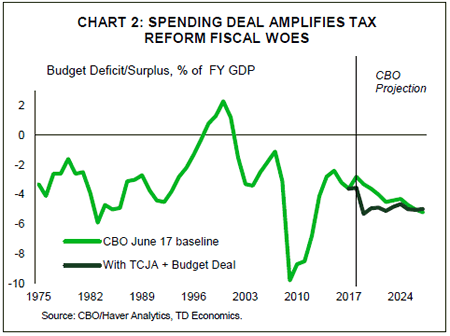
With tax cut stimulus already expected to keep U.S. growth above trend, there is little need for more stimulus. Yet, that’s effectively what the federal government budget deal signed into law this morning delivers. The $300 billion increase in the spending cap over two years could foster additional inflationary pressures at a time when the economy is already operating at close to full capacity. And, higher issuance of Treasuries could put further upward pressure on yields. Moreover, the plan could have a more material effect on growth than tax cuts, since consumers are likely to save a share of the disposable income accrued from tax reform. Growth in 2019 will likely be augmented the most, assuming that spending gets underway in the second half of this year. But, the increase in the deficit would limit the government’s ability to respond to any large scale downturn in the future (Chart 2). Chart 2: Spending Deal Amplifies Tax Reform Fiscal WoesAll told, any increase in investment would be a positive for future trend growth, providing further upside risk around our December forecast.
As market volatility surged, Fed speakers this week appeared unconcerned about financial market developments, instead choosing to reinforce their positive economic outlook. FOMC members had previously noted that equities were overvalued and therefore showed no sign of concern over the widespread sell-off. Voting members Dudley and Williams noted in speeches that wage inflation had picked up as expected and that markets are now adjusting to global monetary policy accommodation removal. This may help calm investor fears of faster rate hikes than previously expected, with the first of three hikes this year expected in March.
Next week, investors will turn their attention to hard data. Of particular interest will be advanced January retail sales data that should provide an indication of whether or not first quarter growth will be affected by the residual seasonality that has led to first quarter weakness in three of the previous four years. Although tax cuts have only started to boost pay checks in February, we anticipate that household spending has continued to be propped up by jobs and wage gains and will contribute strongly to economic activity again in the first quarter.
Canada – A Sea Of Red
It was a sea of red in Canadian financial markets this week, with the S&P TSX down 3% from last Friday’s close; the WTI oil benchmark sliding 8% to a 1-month low of just under US$60 per barrel; and the Canadian dollar falling back below the 80 US cent mark. The bleeding in Canadian markets was part of a broader based selloff, driven by uncertainty surrounding the path for U.S. interest rates now that wage growth appears to be picking up – increasing inflation potential – and a new Fed Chair coming in.
A correction had been in store for a while, given the relatively straight line up that has characterized most equity and commodity markets recently. Hence, at least with respect to commodity prices, the recent pullback has helped to bring prices closer to fundaments. At US$60 per barrel, oil prices are still on the high side given expectations for growth in non-OPEC production. Already, US output has surged to a record high, with a whopping 1 million barrel per day increase expected for the year as a whole. And, given that speculative activity was – prior to this week – sitting at a record high, risks for oil prices remain tilted to the downside.
Canadian data out this week certainly didn’t help markets. International trade data for December showed a further widening in the trade deficit. For Q4 as a whole, import volumes were up 1.2% while export volumes edged up by a mere 0.3%. As such, net trade will be a drag on growth during the quarter. Still, overall economic growth in Q4 is on track to come in at a healthy pace of about 2.2%. With the loonie expected to hover around current levels, and demand expected to remain healthy thanks to robust growth Stateside, Canada’s trade picture should improve in 2018, actually contributing to overall growth.
Employment data was also soft. The Canadian economy shed 88k jobs in January, and the unemployment rate ticked up a point to 5.9%. The losses were concentrated in part-time positions – which were down by a massive 137k positions – and led by Ontario where 59k part-time jobs were lost. This loss in employment in the province coincided with a 23% jump in minimum wage. Surprisingly perhaps, accommodation and food services, one of the sectors most exposed to minimum wages, added jobs (+2.2k) in Ontario in January. While certainly a weak report, it follows a record-breaking string of gains and points to an economy moving back toward a more neutral pace of growth.
Housing starts were the bright spot this week, as they topped 200k units for an 8th straight month – and this came despite some unfavourable weather conditions in parts of the country. While kicking off the year on a strong note, homebuilding activity is likely to soften in the coming months, as tighter lending rules and rising mortgage rates put a dent in demand.
All told, this week’s data won’t alter the Bank of Canada’s outlook much. Economic growth is unfolding largely as expected and the remains near full employment. With several risks on the radar – including tighter mortgage lending requirements, provincial minimum wage hikes and NAFTA renegotiations – the tightening cycle is likely to be gradual, with the next hike not expected until July.
U.S.: Upcoming Key Economic Releases
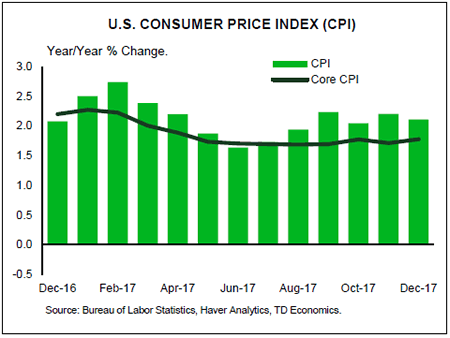
U.S. Consumer Price Index – January
Release Date: February 14, 2018
Previous Result: 0.2% m/m, core 0.2% m/m
TD Forecast: 0.3% m/m, core 0.2% m/m
Consensus: 0.3% m/m, core 0.2% m/m
We expect headline CPI inflation to moderate to 1.9% y/y in January, with prices up a seasonally adjusted 0.3% m/m. Energy prices should be a net positive, led by higher gasoline prices. We also see scope for a pickup in food prices, helped by dollar depreciation. Excluding food and energy, we expect core CPI to print a second consecutive 0.2% m/m increase. One tailwind is dollar weakness, which in addition to food could lend a boost to weak categories like apparel.
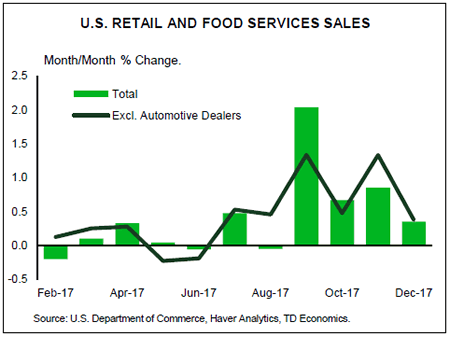
U.S. Retail Sales – January
Release Date: February 14, 2018
Previous Result: 0.4%, ex-auto 0.4%
TD Forecast: 0.1%, ex-auto 0.5%
Consensus: 0.2%, ex-auto 0.5%
We expect retail sales to rise 0.1% in January, held down by motor vehicle sales. Light weight auto and truck sales retraced to 17.0m from 17.8m, pointing to a sizeable decline in motor vehicle and parts sales. Gasoline station receipts will likely see a boost from higher gasoline prices. But aside from that, we expect a relatively modest 0.3% rise in the control group (excluding auto, gasoline station, food services and building material sales). Risks are generally to the downside amid the past collapse in the saving rate.
Canada: Upcoming Key Economic Releases
Canadian Manufacturing Sales – December
Release Date: February 16, 2018
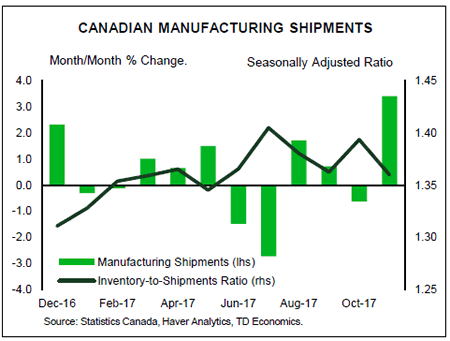
Previous Result: 3.4% m/m
TD Forecast: 0.7% m/m
Consensus: N/A
Manufacturing sales are forecast to rise 0.7% m/m in December on the continued normalization of motor vehicle production and a positive tailwind from energy prices. Auto output rebounded by 14% m/m in November but remains well below levels from Q2, after which the industry was hit by the combined impact of a labour dispute and retooling shutdowns. Petroleum production should lend another tailwind due to a rise in gasoline prices while a strong performance in exports of metals and minerals bodes well for factory sales. Real manufacturing sales growth should come in near the nominal print due to a modest decline in factory prices, which would leave volumes up roughly 2.3% y/y and 3.3% for 2017 as a whole.
