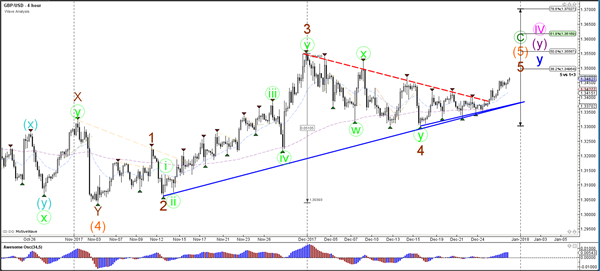
Currency pair GBP/USD
The GBP/USD bullish break is still moving higher and could see price move towards the Fibonacci targets of waves 5. The uptrend seems to be part of a wave 5 (brown) within wave C (green).
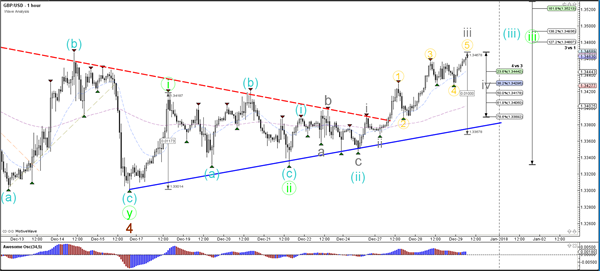
The GBP/USD seems to be building an internal 5 wave (grey) pattern within a larger wave 3 (blue/green) breakout. A bearish retracement could occur as part of wave 4 (grey) but price could some time before the correction is completed. A break below the 61.8% Fib would make a wave 4 (grey) less likely.
Currency pair EUR/USD
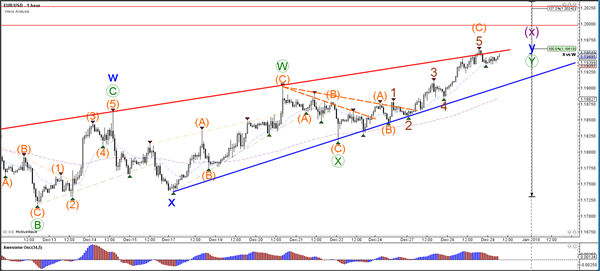
The EUR/USD has reached the strong resistance zone (red lines) and is building a rising wedge chart pattern (red/blue lines). A bearish reversal could send the EUR/USD lower to test the wave 2 vs 1 (pink) and the Fib levels of wave Y (purple) whereas a bullish breakout could indicate a continuation of the uptrend.
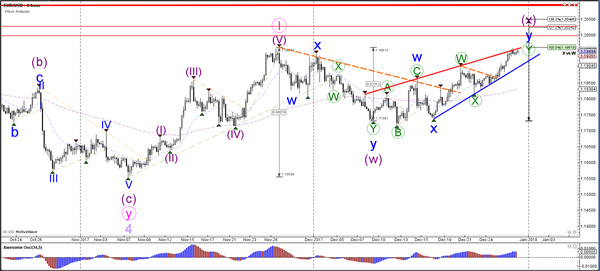
The EUR/USD is testing the resistance trend line (red) and the Fibonacci levels of wave Y (orange) of the rising wedge pattern.
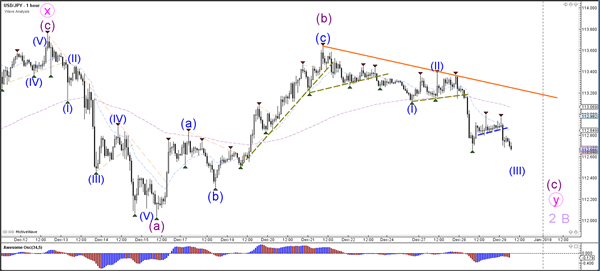
Currency pair USD/JPY
The USD/JPY bearish price action is now challenging a larger support trend line. A break below the support trend line (blue) could indicate a larger bearish wave C (purple) correction within wave 2 or B (light purple).
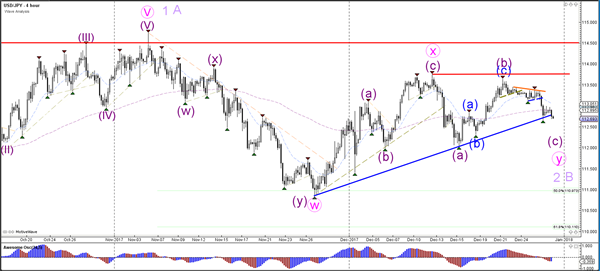
The USD/JPY bearish breakout could see price retest the support levels around 112.