Key Highlights
- Gold price started a fresh upside move from the $1236.50 swing low against the US Dollar.
- Buyers succeeded in pushing the price above a major bearish trend line at $1258 on the 4-hours chart of XAU/USD.
- The price is now heading towards a few major resistances – $1268, $1270 and $1274.
- The US Building Permits in Nov 2017 decreased by 1.4%, less than the forecast of -4.9%.
Gold Price Technical Analysis
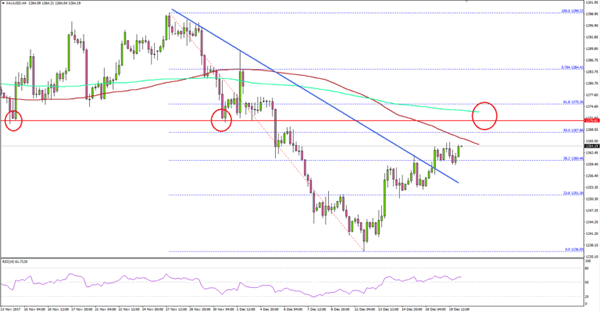
After a major downtrend, Gold price found bids near $1236 against the US Dollar. The price started a fresh upside move, but it is now facing a few major resistance around $1270.

Looking at the 4-hours chart of XAU/USD, there was a decent support base formed at $1236.50. The price recovered nicely and moved above the 23.6% Fib retracement level of the last major drop from $1299.22 to $1236.50.
More importantly, there was a break above a major bearish trend line at $1258 on the 4-hours chart. It opened the doors for more gains above $1260. Having said that, the price is now facing an uphill task around $1270.
An initial resistance is around the 100 simple moving average (red, 4-hour) at $1268, which is near the 50% Fib retracement level of the last major drop from $1299.22 to $1236.50.
Above the mentioned $1268, the $1270 pivot level is a major resistance. Finally, the 200 simple moving average (green, 4-hour) is at $1274. Should the price succeed in settling above the $1274 level, the price could continue its uptrend and move towards the $1285 and $1290 levels.
On the downside, the broken resistance at $1258 may now act as a support going forward. Below $1258, the $1250 is a decent support.
Today, the US Existing Home Sales figure for Nov 2017 will be released. The sales are likely to increase by 1%, but if there is no increase in sales, Gold price may gain traction. On the other hand, a better outcome could spark a downside reaction towards $1250.
