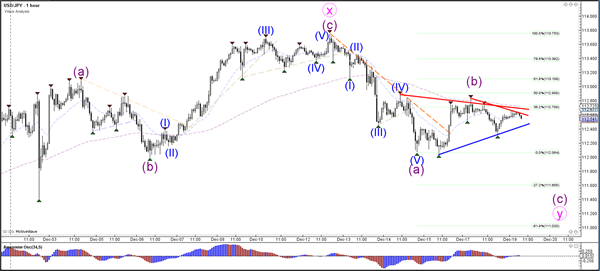
Currency pair USD/JPY
The USD/JPY is building a triangle correction (red/blue lines) which is probably part of a wave B (purple). A break below support could see price extend its bearish momentum towards the Fib targets at 111 and 110.
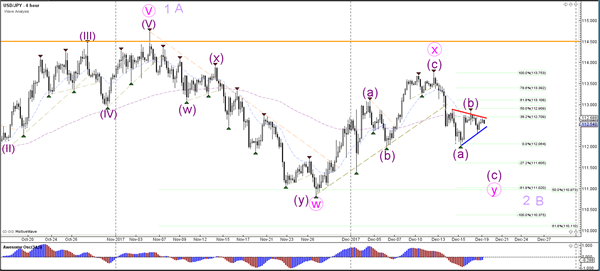
The USD/JPY respected the 38.2% Fib but could see a deeper Fib bounce if price were to break above resistance. A break above the 100% Fib level at 113.75 invalidates the ABC zigzag whereas a break below the support could confirm it
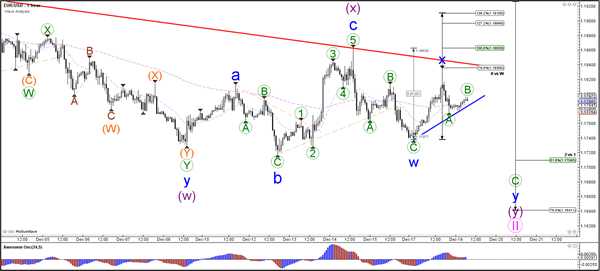
Currency pair EUR/USD
The EUR/USD needs to break the support or resistance trend line before the short-term direction becomes clear. A break below the 100% Fib level of wave 2 vs 1 invalidates the wave 2 (pink) and indicates an expansion of wave 4 (light purple).
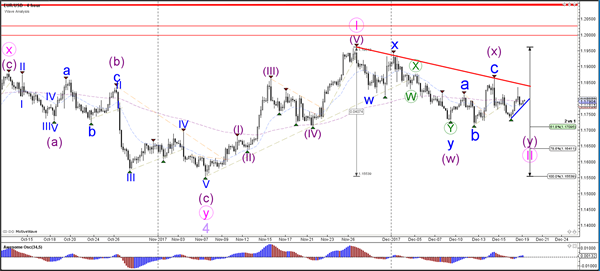
The EUR/USD completed a bearish ABC (green) but the bullish rally is probably an extension of the larger correction and has been labelled as a wave X (blue). The wave X is invalidated if price breaks above the 138.2% Fib and becomes less likely when price breaks above the 100% Fib.
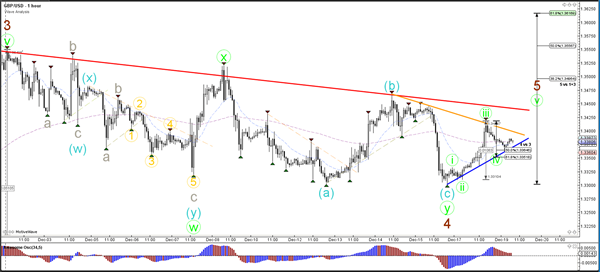
Currency pair GBP/USD
The GBP/USD is in between a larger support and resistance trend line. The correction could be a large bull flag chart pattern. A bullish breakout could confirm the pattern and a wave 5 of wave C
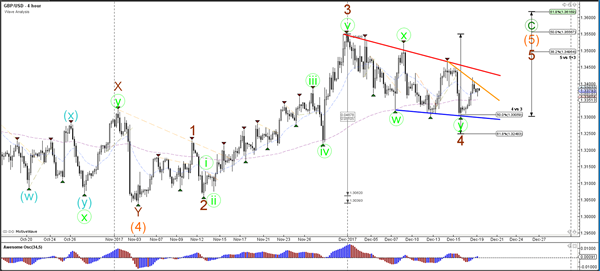
The GBP/USD break below the 61.8% makes a wave 4 less likely.