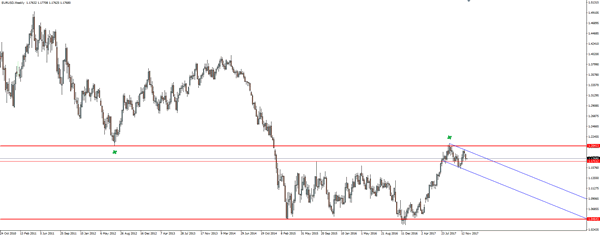
After benefiting from USD weakness and ripping higher though channel resistance, EUR/USD was unable to break the next level of higher time frame resistance and has started to slowly edge back down.
But in edging back down, the pair is starting to form what look awfully close to a bull flag on the higher time frame charts. Take a look at the weekly here below:
EUR/USD Weekly:

The single lower high and lower low that you can see connecting each trend line, has at least started to print the bull flag and given us at least some basis to start to look for longs.
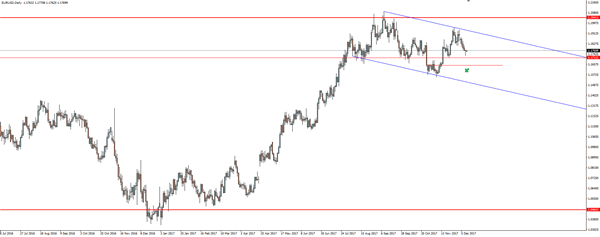
As the above is forming on a weekly and still unfolding, I don’t want to zoom in too far, so I’m only going down to the daily. Check out the levels I’m looking at below:
EUR/USD Daily:

Mostly I want you to focus on the horizontal zone and then the short term (relatively) previous resistance level that we will be looking to act as support.
If it does in fact turn out this way, this is an excellent level to look at taking a long position off of, and most importantly allows you to manage your risk around the swing low just underneath.
