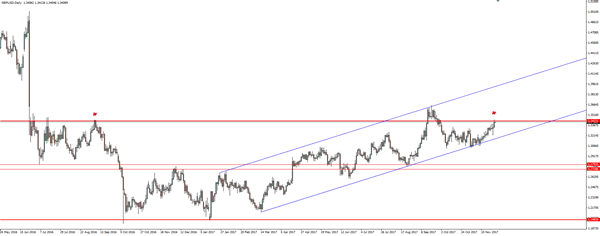
We’ve been watching this GBP/USD channel as price moves up between horizontal support/resistance zones.
Price has found some bullish legs following the last tap that we spoke about on the blog last week, but has now reached previous swing high resistance and stalled.
GBP/USD Daily:

How price behaves around this horizontal resistance level will be key as to whether we reach the upper band of the channel, or whether we just head back down again. Either way, this is the level that traders can manage their risk around.
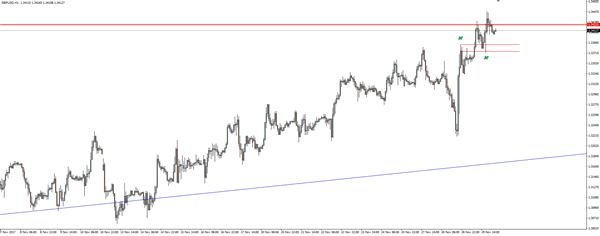
Now zoom into an intraday chart and take a look at the hourly below.
GBP/USD Hourly:

These are the sorts of short term support turned resistance (and vice versa) that we want to look for. Especially on the short side if the above daily level does in fact hold.
