
 and the 200 simple moving average (green, 4-hour). It traded below a key contracting triangle at $67.85.)
Key Highlights
- WTI Crude Oil prices started a fresh decline below the $70.00 support.
- It traded below a key contracting triangle at $67.85 on the 4-hour chart.
- Gold prices started another increase and surpassed the $2,895 resistance.
- Bitcoin restarted its decrease and traded below $88,000.
WTI Crude Oil Price Technical Analysis
WTI Crude Oil price failed to clear the $71.20 resistance. The price started a fresh decline below $70.20 and $70.00 to enter a bearish zone.
Looking at the 4-hour chart of XTI/USD, the price settled below the 100 simple moving average (red, 4-hour) and the 200 simple moving average (green, 4-hour). It traded below a key contracting triangle at $67.85.
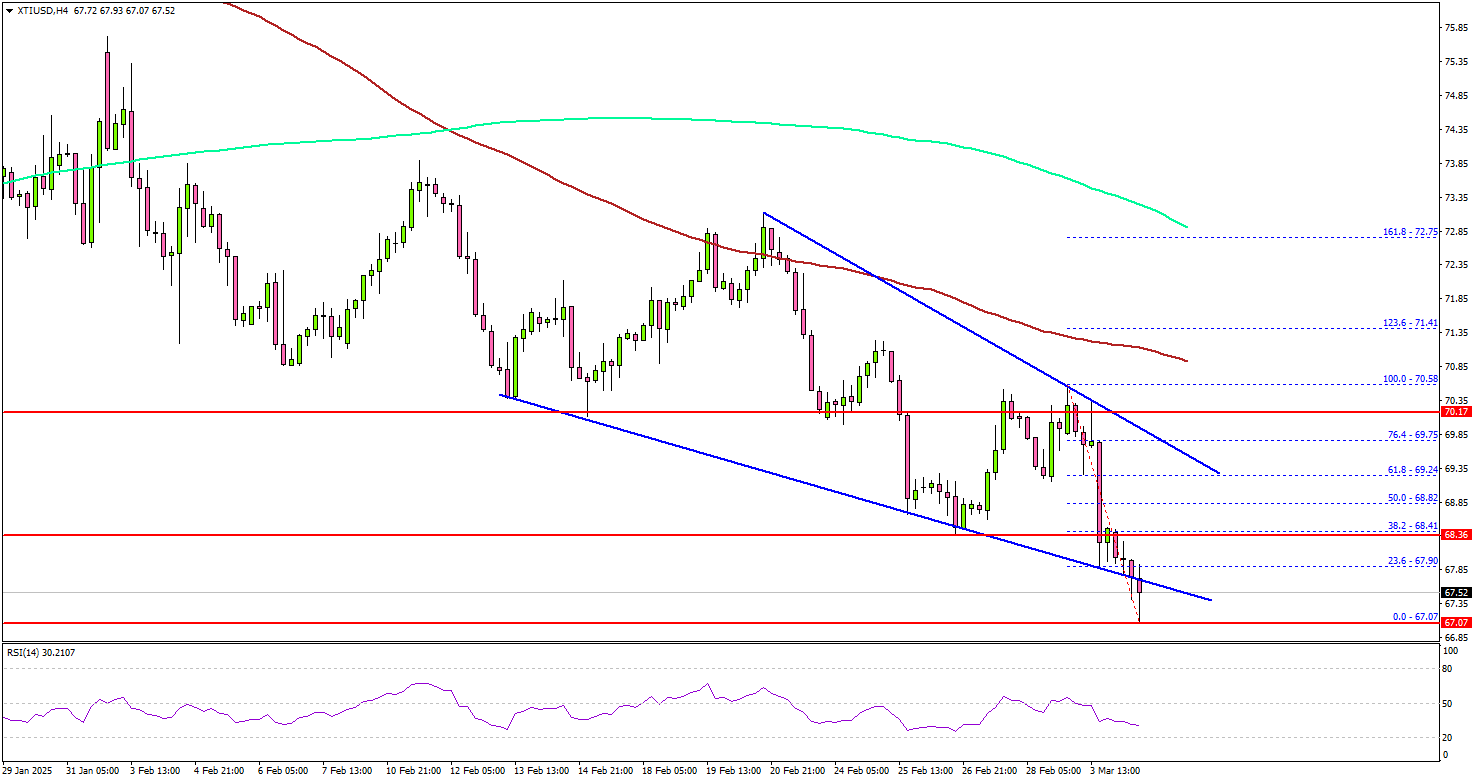
The bears seem to be in action below the $68.80 pivot level. On the upside, the price is facing hurdles near the $68.40 level. The main hurdle is now near the $69.20 zone, above which the price may perhaps accelerate higher.
In the stated case, it could even visit the $70.80 resistance and the 100 simple moving average (red, 4-hour). Any more gains might call for a test of the $72.00 resistance zone in the near term.
On the downside, the first major support sits near the $67.00 zone. A daily close below $67.00 could open the doors for a larger decline. The next major support is $65.80. Any more losses might send oil prices toward $65.00 in the coming days.
Looking at Gold, there was a strong increase above the $2,895 level and the price could extend gains in the near term.
Economic Releases to Watch Today
- Euro Zone Services PMI for Feb 2025 – Forecast 50.7, versus 50.7 previous.
- UK Services PMI for Feb 2025 – Forecast 51.1, versus 51.1 previous.
- US Services PMI for Feb 2025 – Forecast 49.7, versus 49.7 previous.
- US ISM Services Index for Feb 2025 – Forecast 52.9, versus 52.8 previous.