
) ended at 192.91, wave ((b)) ended at 191.46 and wave ((c)) ended at 193.05. This completed wave 4 in higher degree.)
Short Term Elliott Wave view in GBPJPY shows the decline from 12.30.2024 high is in progress as a 5 waves impulse. Down from 12.30.2024 high, wave 1 ended at 195.72 and wave 2 rally ended at 198.25. Pair has resumed lower in wave 3 towards 190.06 as the 30 minutes chart below shows. Wave 4 unfolded as a zigzag Elliott Wave structure. Up from wave 3, wave ((a)) ended at 192.91, wave ((b)) ended at 191.46 and wave ((c)) ended at 193.05. This completed wave 4 in higher degree.
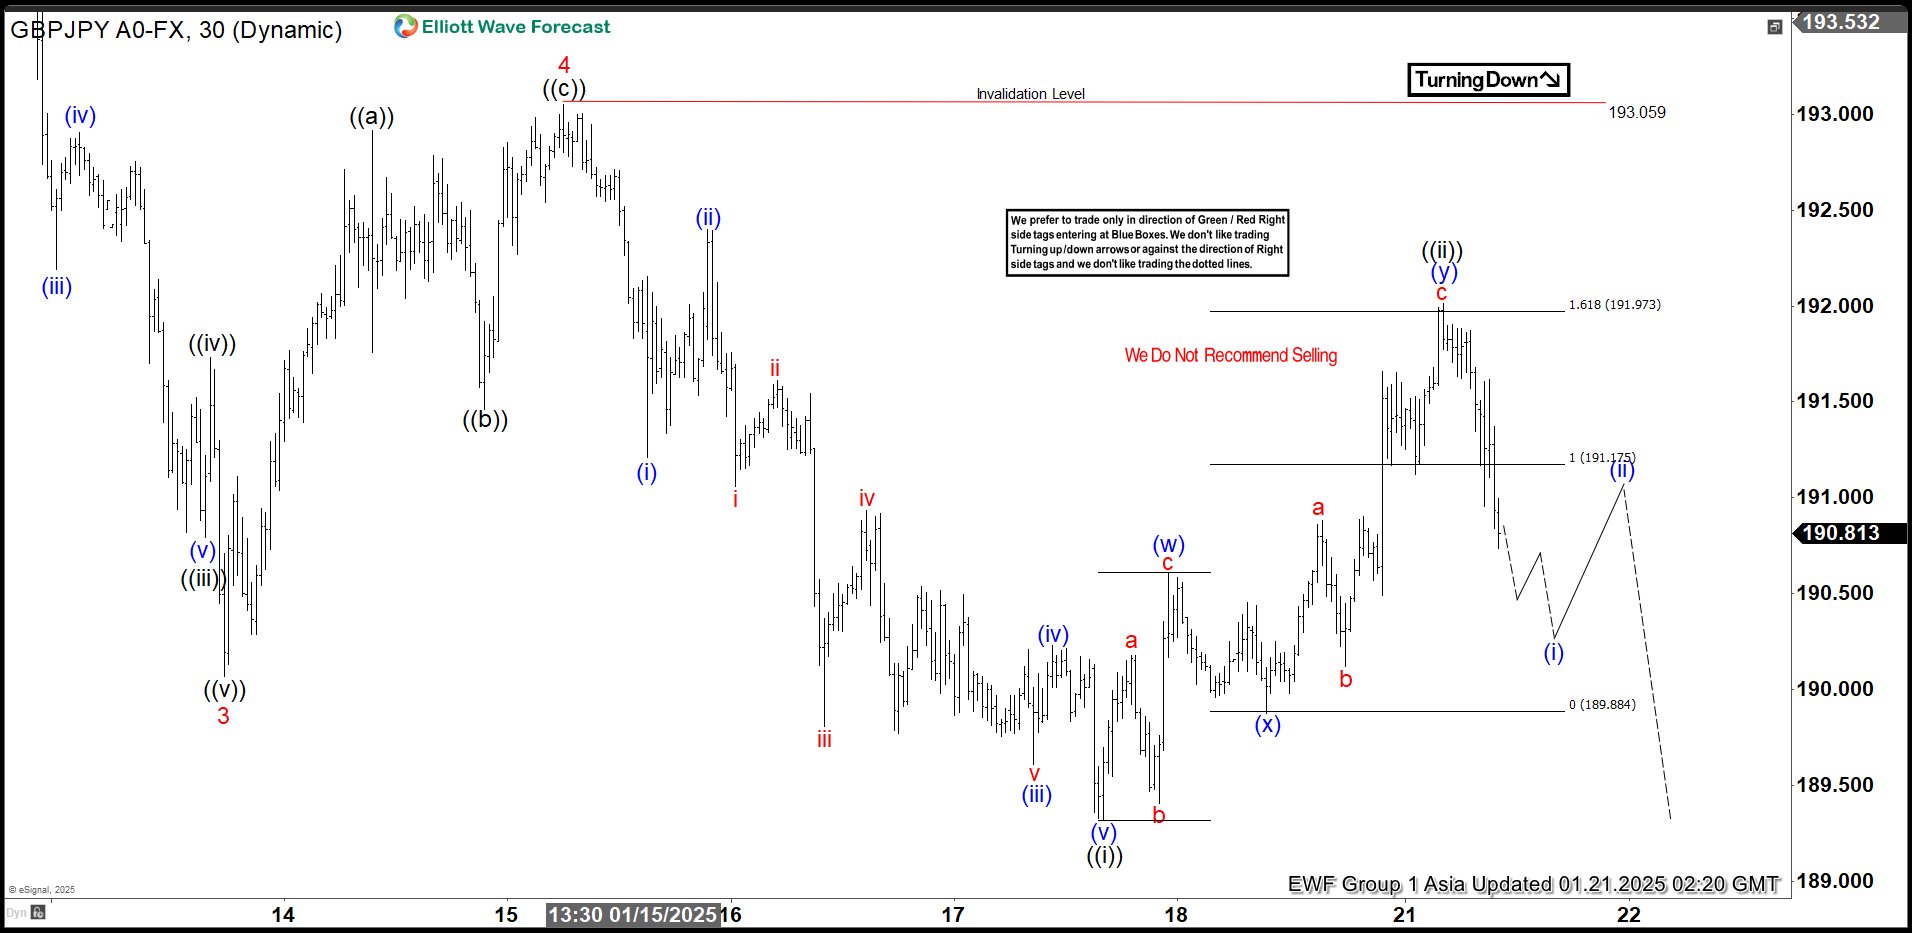
Pair has turned lower in wave 5. Down from wave 4, wave (i) ended at 191.21 and wave (ii) ended at 192.4. Wave (iii) lower ended at 189.6 and wave (iv) ended at 190.2. Final leg wave (v) ended at 189.323 which completed wave ((i)) of 5. Pair corrected higher in wave ((ii)) with internal subdivision of a double three. Up from wave ((i)), wave (w) ended at 190.61 and wave (x) ended at 189.87. Final leg wave (y) ended at 192.01 which completed wave ((ii)) in higher degree. Near term, as far as pivot at 193.05 high stays intact, expect pair to extend lower.
GBPJPY 30 Minutes Elliott Wave Chart
GBPJPY Elliott Wave Video
You are currently viewing a placeholder content from Default. To access the actual content, click the button below. Please note that doing so will share data with third-party providers.