
- Five mega-cap technology stocks (Alphabet, Microsoft, Meta, Apple and Amazon) will report their respective earnings results this week.
- Bullish momentum of the recent 4-week rally seen in the 10-year US Treasury yield remains intact.
- A continuation of the surge in the 10-year US Treasury yield may challenge the positive vibes from the US mega-cap technology earnings results.
Pivotal week for the Nasdaq 100 as five mega-cap technology stocks; Alphabet, Microsoft, Meta, Apple and Amazon that have a combined weightage of around 31% will report their respective Q3 earnings results this week.
Ex-post earnings share performances of these five mega-cap technology firms after one to two days from their prior Q2 respective earnings results release dates had been lacklustre.
So far rosy expectations have been set for the Q3 earnings results of Alphabet, Meta, and Amazon that are poised for double-digit earnings growth supported by ad spending. Apple may get an uplift on sales of its latest iPhone 16 model from its key China market accordingly to a news report from Bloomberg.
Nasdaq 100 resilience may be tested by rising long-term 10-year US Treasury yield
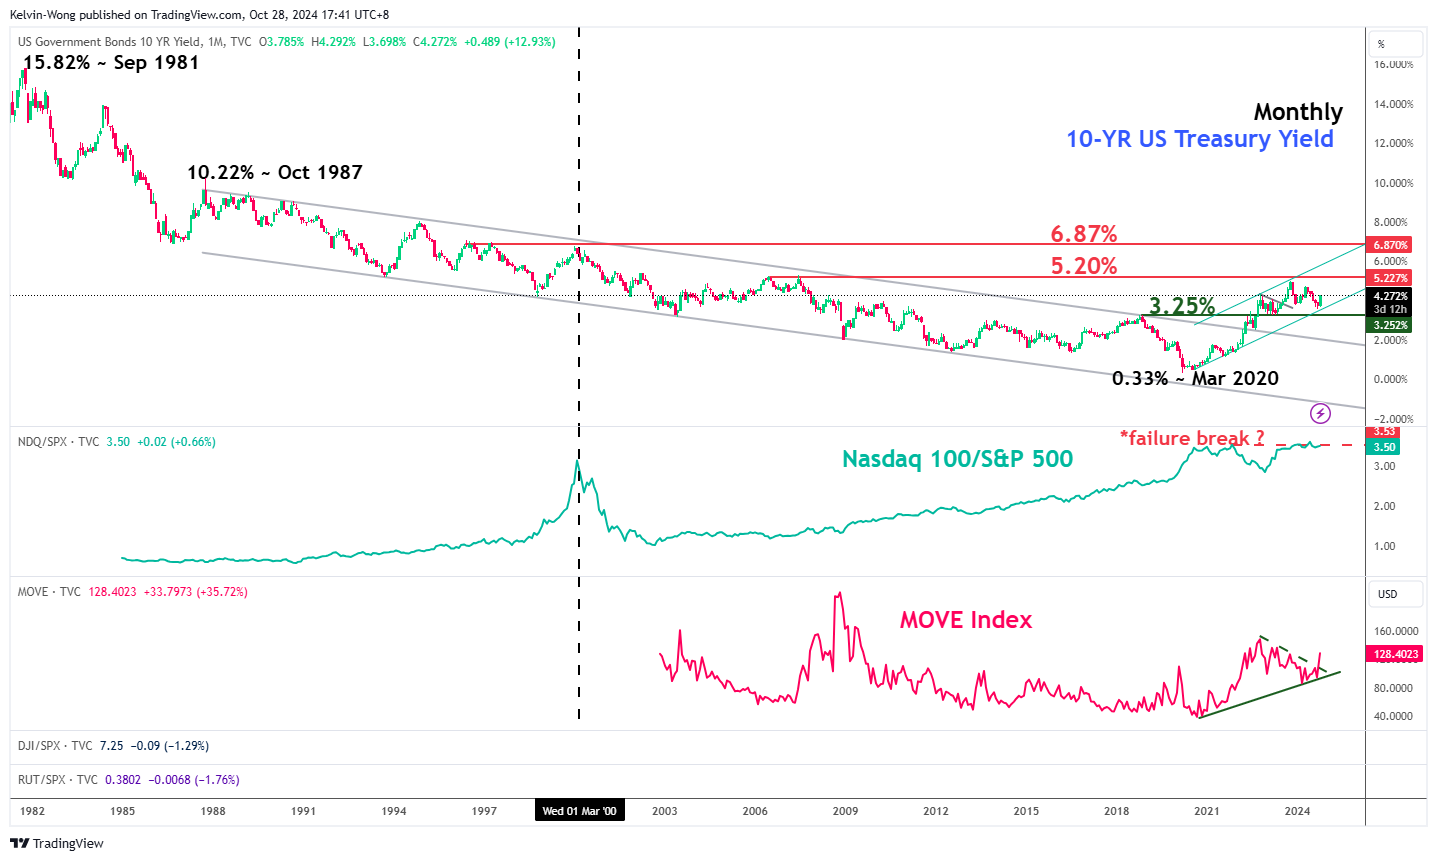
Fig 1: 10-year US Treasury yield long-term secular trend with Nasdaq 100/S&P 500 ratio & MOVE Index as of 25 Oct 2024 (Source: TradingView, click to enlarge chart)
The Nasdaq 100 has so far managed to notch a month-to-date return of 1.45% for October as of 25 October while the 10-year US Treasury yield has rallied by 50 basis points over the same period, its biggest monthly jump in almost two years.
This recent bout of significant push up in the 10-year US Treasury yield has been accompanied by rising interest rate implied volatility where the MOVE Index has jumped to a one-year high.
Based on past data, such swift increase in the 10-year US Treasury yield and MOVE Index have saw the Nasdaq 100 staged a medium-term corrective decline between July 2023 to October 2023 and November 2021 to October 2022 (see Fig 1).
The “Trump Trade” narrative has gained traction in the recent week due to rising odds of Republican nominee Trump winning the US presidential election based on data from betting markets (61%Trump versus 37% Harris based on Real Clear Politics data as of 27 October).
So far Trump’s proposed key policies of a lower corporate tax rate, and higher trade tariffs on China and rest of the world imports to the US is likely to see a resurgence of inflationary pressure from a medium-term to long-term horizon.
Hence, a rising 10-year US Treasury yield that is driven by inflationary rather than economic growth uplift is likely to be detrimental to the Nasdaq 100 from a valuation standpoint.
Nasdaq 100’s market breadth has remained lacklustre
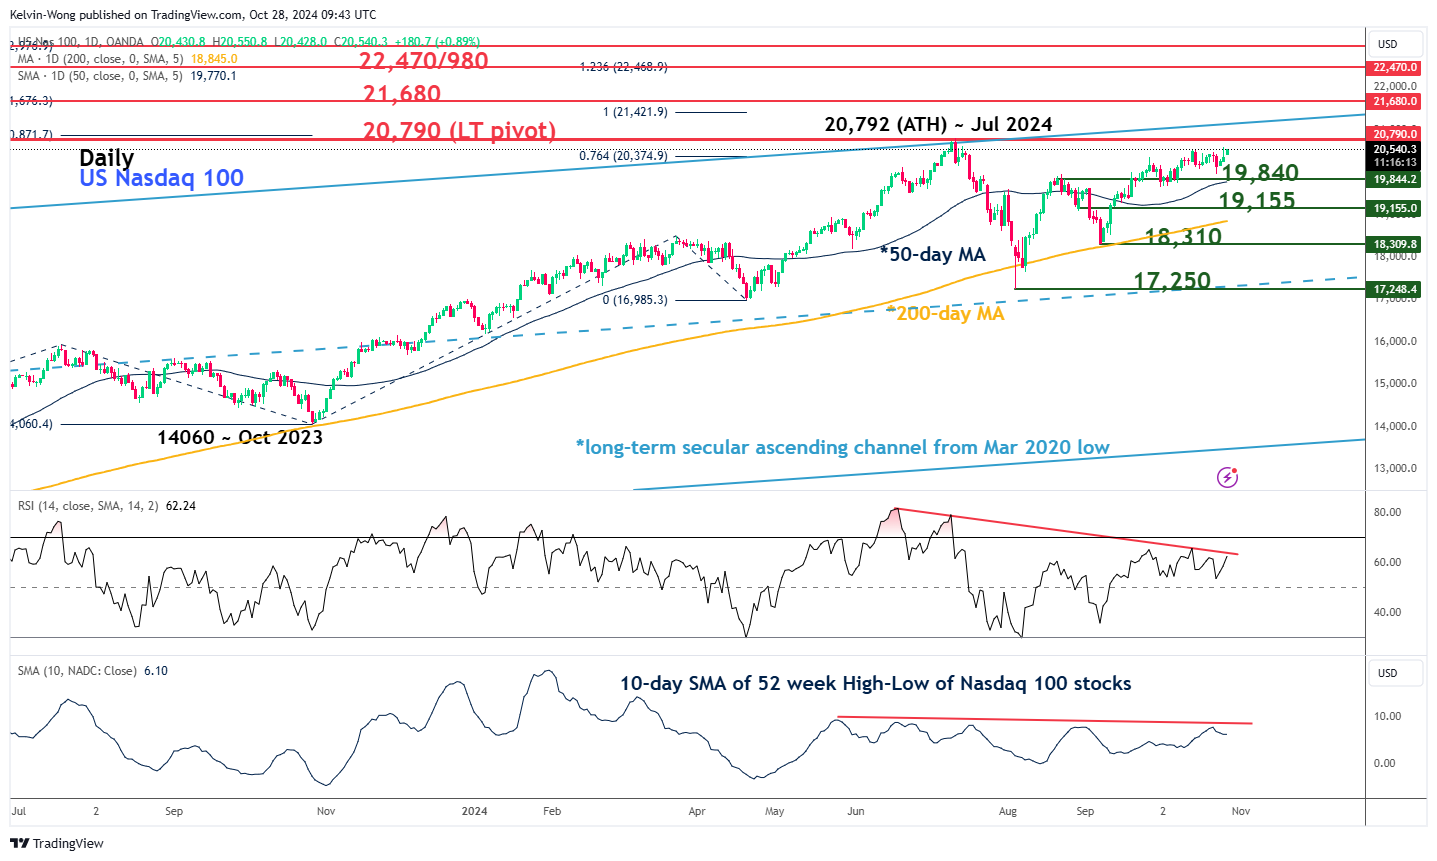
Fig 2: Nasdaq 100 CFD major & medium-term trends as of 28 Oct 2024 (Source: TradingView, click to enlarge chart)
The 10-day moving average of the Nasdaq 100’s 52-week high minus 52-week low market breadth indicator has continued to print a lower low and inched downwards.
This observation suggests that there are fewer Nasdaq 100 component stocks hitting new 52-week highs; a potential bearish reversal may be looming on the horizon for the Nasdaq 100 (see Fig 2).
Watch the 20,790 key long-term pivotal resistance on the Nasdaq 100 CFD Index (a proxy of Nasdaq 100 E-mini futures), a break below the 19,840 intermediate support (also the 50-day moving average) may expose the next medium-term supports of 19,155 and 18,310.
On the other hand, a clearance above 20,790 long-term pivotal resistance invalidates the bearish scenario to see the next medium-term resistances coming in at 21,680 and 22,470/980.