over the last couple of days. If the market continues to dive, then immediate support could come from the 57,600 support level ahead of the 52,470 barrier, registered on September 7.)
- Bitcoin battles with 60,200 area
- RSI implies further decreases
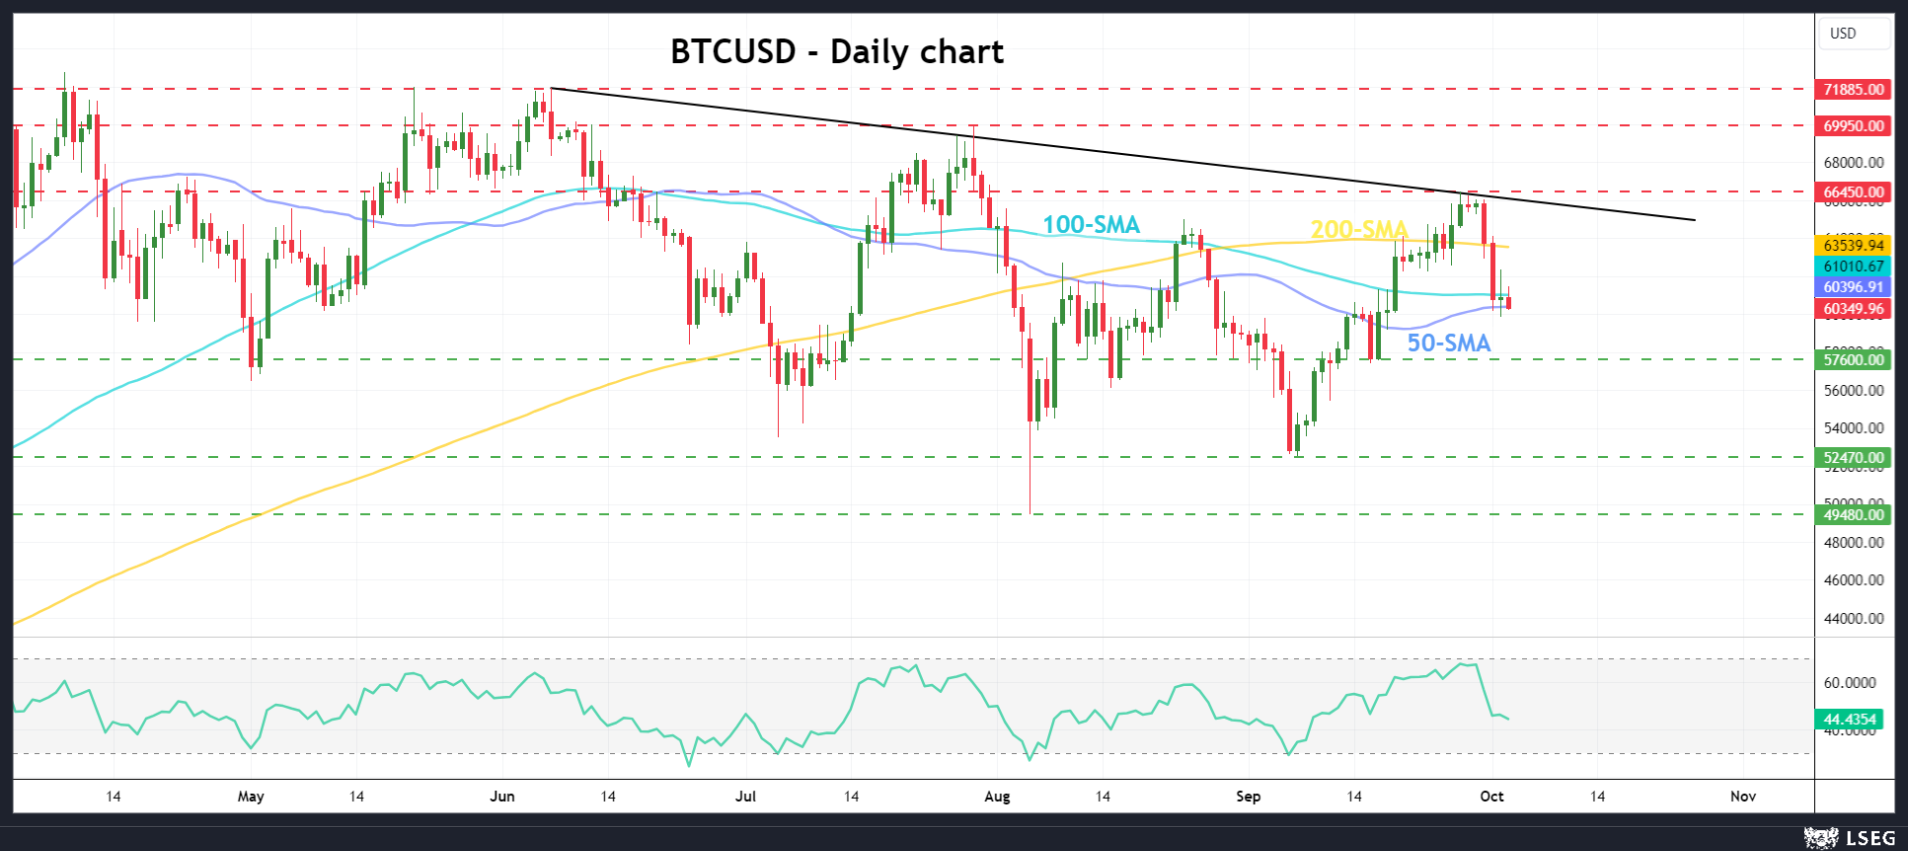
Bitcoin prices have been falling since they peaked at 66,450 and have been hovering within the 50- and 100-day simple moving averages (SMAs) over the last couple of days. If the market continues to dive, then immediate support could come from the 57,600 support level ahead of the 52,470 barrier, registered on September 7.
On the other hand, if the market successfully climbs above the 100-day SMA, it may re-challenge the 200-day SMA, which is near the 63,540 area. Further increases may open the way towards the previous top of 66,450 before heading north to the 69,950 resistance level.
Technically, the RSI indicator has been in a strong declining move, crossing beneath the 50 zone after the rally to the overbought region, suggesting a steeper downside trend.
All in all, bitcoin has been in a bearish tendency since it peaked at 71,885 on June 7, and any new lows below the 49,480 bottom could endorse this outlook. However, a rise above 71,885 could switch the outlook to a more bullish one.