
- Oil prices fell by 2.4% in early European trade, possibly due to demand concerns and rebalancing.
- Concerns about China’s economic recovery and the possibility of increased Libyan oil production are also weighing on oil prices.
- From a technical perspective, the H4 chart showing RSI divergence. Higher prices ahead?
Oil prices fell off sharply in early European trade, declining around 2.4% with Brent trading at 70.600 at the time of writing. There does not appear to be one reason in particular for the selloff, however demand concerns remain in play with Japan and China reporting underwhelming factory data.
When you factor in that today is the first day of Q4, could rebalancing be at play as well? This is along the line of my thinking given the lack of any singular reason for the drop in price.
The Reuters September poll on Oil prices downgraded for a fifth consecutive month. This is in line with what we have been seeing of late with oil prices as there seems to be concern around demand and potentially excess supply in Q4 and 2024 and Q1 2025.
Looking more closely at the Reuters Poll of 41 analysts and economists conducted over the past two weeks, the projection for Brent Crude was revised down to 81.52 a barrel from a previous 82.86. (period average forecasts).
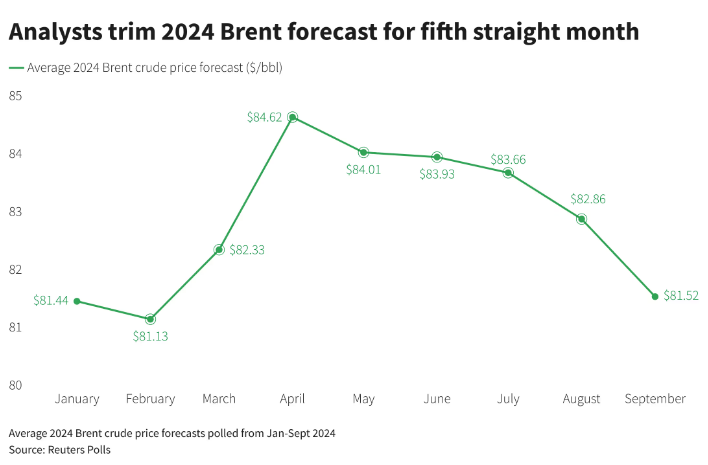
Source: LSEG, Reuters
This follows downgrades from both the IEA and OPEC + ahead of tomorrow’s meeting by the oil cartel. Markets still seem concerned that OPEC + may go ahead with an increase in production from December with many analysts believing the same. However, given the rhetoric from OPEC + members and Saudi Arabia and Russia in particular I think this may be a misguided notion. I foresee further delays in the production increase as long as oil prices remain in the lower $70-75 a barrel range.
China a Concern as Stimulus Needs Time to Take Effect
Meanwhile concerns were raised once more around China following the release of Manufacturing PMI data yesterday. This comes a week after the stimulus measures which have had a profound impact on the Chinese stock market as well as those of emerging markets and commodities.
However, on the Oil front there remains concerns that the stimulus will not be enough for China to reach its 2024 GDP target and may be too late to see a stark increase in oil demand. This could be another factor weighing on Oil in the European session.
Libya Oil Production and Oil Inventories
An agreement in Libya has also gained traction following yesterday’s announcement by Libya’s eastern based parliament that a new Central Bank Governor would be approved for nomination. This could see the return of Libyan Oil production and exports which could add around 1-1.5 million barrels back to the market at full capacity.
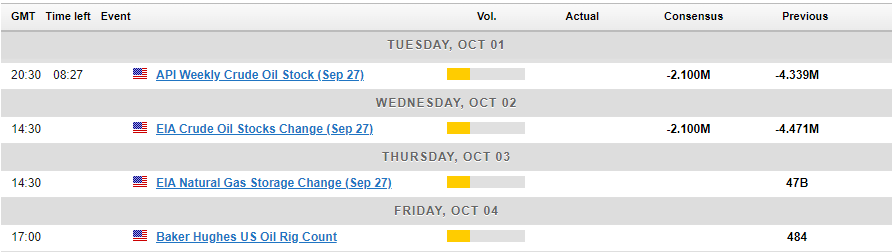
US PMI data this week could also have a minor impact on oil prices before inventory data will once again be key. A poll was conducted by Reuters for US Crude stockpiles which estimated a drop of around 2.1 million barrels for the week ended September 27, 2024. The API will release their data at 20h30 GMT on Tuesday.
Technical Analysis
From a technical perspective, oil has printed a lower high and looks poised for a lower low. However the whipsaw price action in European trade does not instill a lot of confidence in bears at this stage, so close to the psychological 70 a barrel mark.
The daily candle close today could go some way to providing a clearer picture in regard to Oils technical outlook in the near term.
Given the messy picture i have dropped down to a four-hour chart (H4) where we are seeing an aggressive bounce following the selloff this morning. This has now led to a RSI divergence play coming into focus as you can see on the chart below. RSI made a higher low while price made a lower low which could lead to a deeper recovery in oil prices.
Immediate resistance rests at 72.39 before the 100-day MA at 72.95. A break above this could open the door for an aggressive run toward the 200-day MA and the 75.00 psychological level,
Brent Crude Oil Daily Chart, October 1, 2024
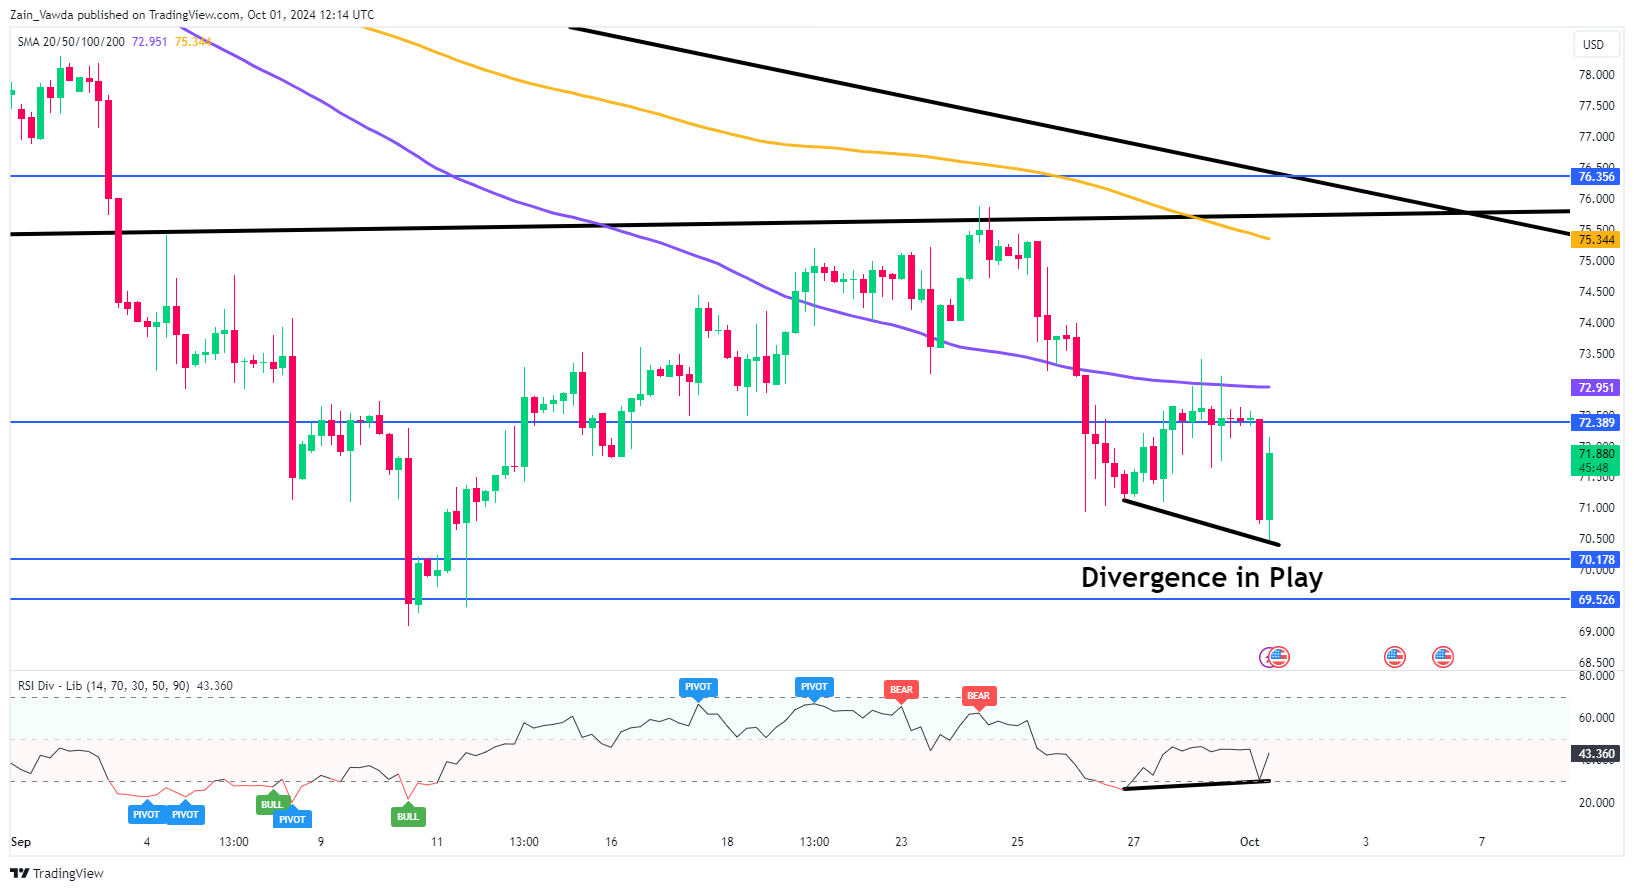
Source: TradingView (click to enlarge)
Support
- 70.50
- 70.18
- 69.50 (key area of confluence)
Resistance
- 72.39
- 72.95
- 75.00