
 slid to a fresh yearly low in the aftermath of the US PCE inflation report. A softer than expected PCE print across the board ramped up bets for another 50 bps cut from the Fed in November.)
- US Dollar Index hits new yearly low after PCE inflation report came in softer than expected.
- PCE data shows personal income rose less than expected, PCE price index increased by 0.1% MoM, and core PCE increased by 0.1%, below expectations.
- DXY is on the edge of a cliff as rate cut bets and dovish Fed rhetoric weigh on the greenback.
The US Dollar Index (DXY) slid to a fresh yearly low in the aftermath of the US PCE inflation report. A softer than expected PCE print across the board ramped up bets for another 50 bps cut from the Fed in November.
The initial impact has seen the US Dollar lose ground to major counterparts and commodities like Gold and Silver tested recent highs. The DXY appears to be on the edge of a cliff as rate cut bets and dovish Fed rhetoric weigh on the greenback.
The PCE data showed that US personal income rose by less than expected. In August 2024, the US personal consumption expenditure (PCE) price index rose by 0.1% month-over-month, following a 0.2% increase in July, aligning with expectations. Service prices saw a 0.2% rise, while goods prices fell by 0.2%. The core PCE index, which excludes food and energy, also increased by 0.1%, down from 0.2% in July and below the anticipated 0.2%. Food prices went up by 0.1%, whereas energy prices dropped by 0.8%.
On an annual basis, the PCE inflation rate decreased to 2.2%, the lowest since February 2021, from 2.5% in July, and was below the expected 2.3%. The core rate slightly increased to 2.7% from 2.6%, meeting forecasts.
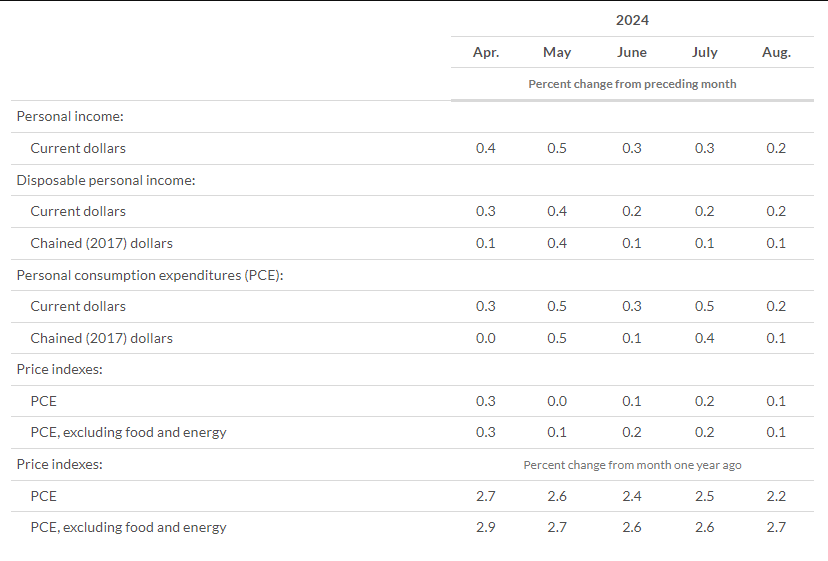
Source: Bureau of Economic Analysis
Markets will now keep an eye on the Michigan sentiment final numbers but barring any surprises this should not have much impact. Looking ahead, market attention will switch to US job numbers.
Traders are favoring a 50 bps cut in November but at this stage it is far from a certainty with Job numbers next week likely to play a major role.
Technical Analysis – US Dollar Index
The US dollar has been flirting with fresh lows since the Fed meeting on September 18. A brief push lower post the PCE release followed but the index has since bounced back to trade at 100.308 at the time of writing.
The 100.00 psychological level is growing ever more vulnerable especially with the jobs data lined up next week. I had actually hoped for a slight bounce from the index today and Monday potentially as we enter the last day of the week, month and quarter.
However, it would appear that for now the bearish pressure is to be maintained with a late bounce on Monday still a possibility ahead of the NFP report on Friday
US Dollar Index Chart, September 27, 2024
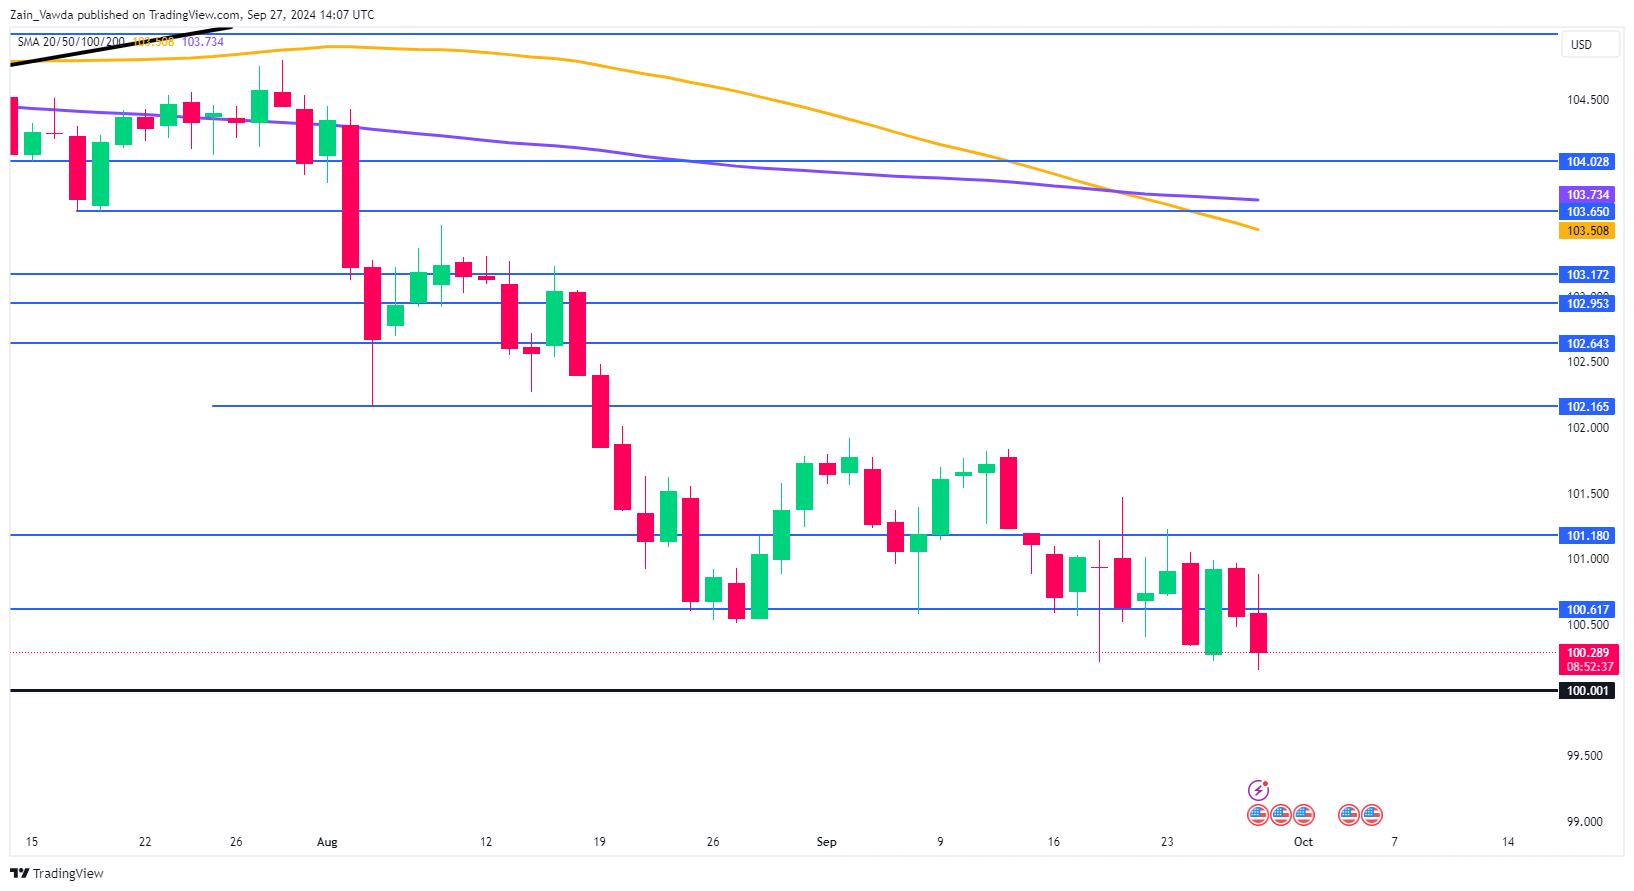
Source: TradingView (click to enlarge)
Support
- 100.00
- 99.500
- 99.000
Resistance
- 100.61
- 101.18
- 101.80