). Afterward, a pullback occurred and completed in September 2023, as wave ((B)).)
Hello traders, welcome to another trade review blog post where we discuss setups from the blue box. In this one, we will look at a recent setup on the EURCAD. We shared this setup with members of Elliottwave-Forecast.
EURCAD has maintained a bullish sequence from the low in August 2022. From that low, the bullish sequence could either complete a 3-wave or a 5-wave structure. Based on the path of least resistance, the price should complete at least a 3-swing sequence. On the weekly chart, we identified the first swing from the August 2022 low to the April 2023 high as wave ((A)). Afterward, a pullback occurred and completed in September 2023, as wave ((B)).
Since September 2023 low, the pair has started the third swing, which we identify as wave ((C)). Wave ((C)) could extend as high as 1.58, which is 805 pips above the current price of 1.4995. With this in mind, we plan to buy pullbacks in 3, 7, or 11 swings along the path of wave ((C)). However, before last week’s rally, we had already shared a trade setup with our members.
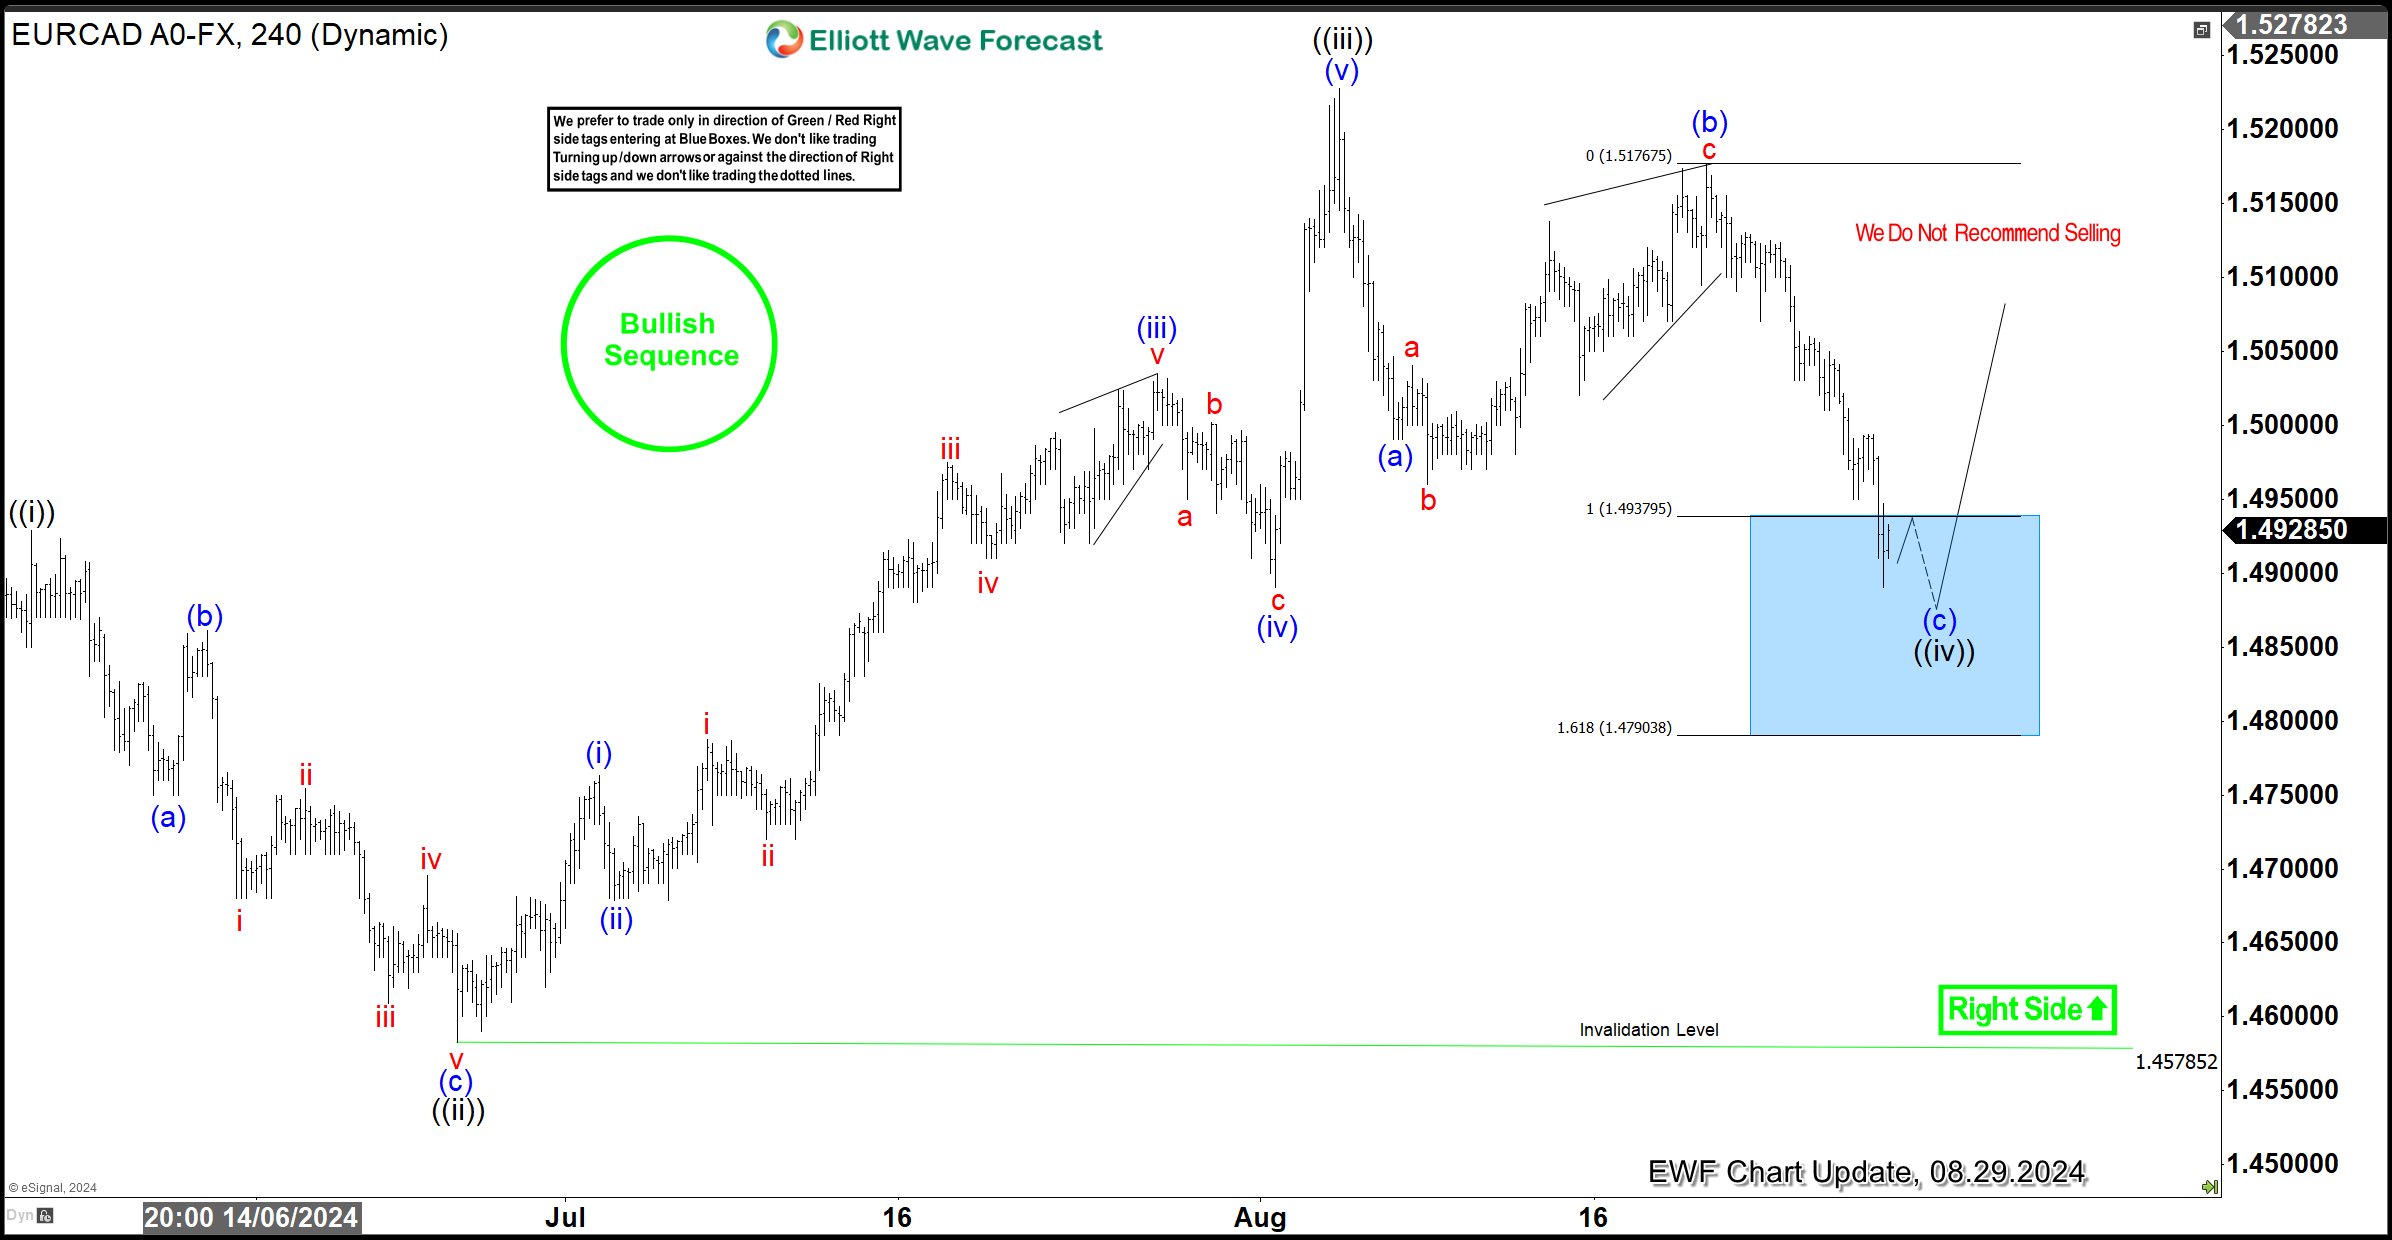
EURCAD H4 Analysis, 08.29.2024
After the price broke above the top of wave ((A)) on both the weekly and daily charts, we informed our members in live analyses and trading rooms that the stage was set to buy the next pullback. The pullback matured about a month later. On August 29, 2024, we shared the H4 chart with members, expecting to go LONG from the blue box. The price reached the blue box, and the LONG trade was triggered with the parameters we provided in the trading journal. Our stop loss was set below the blue box. Additionally, as usual, we planned to take partial profit at 50% of wave (c) of ((iv)).
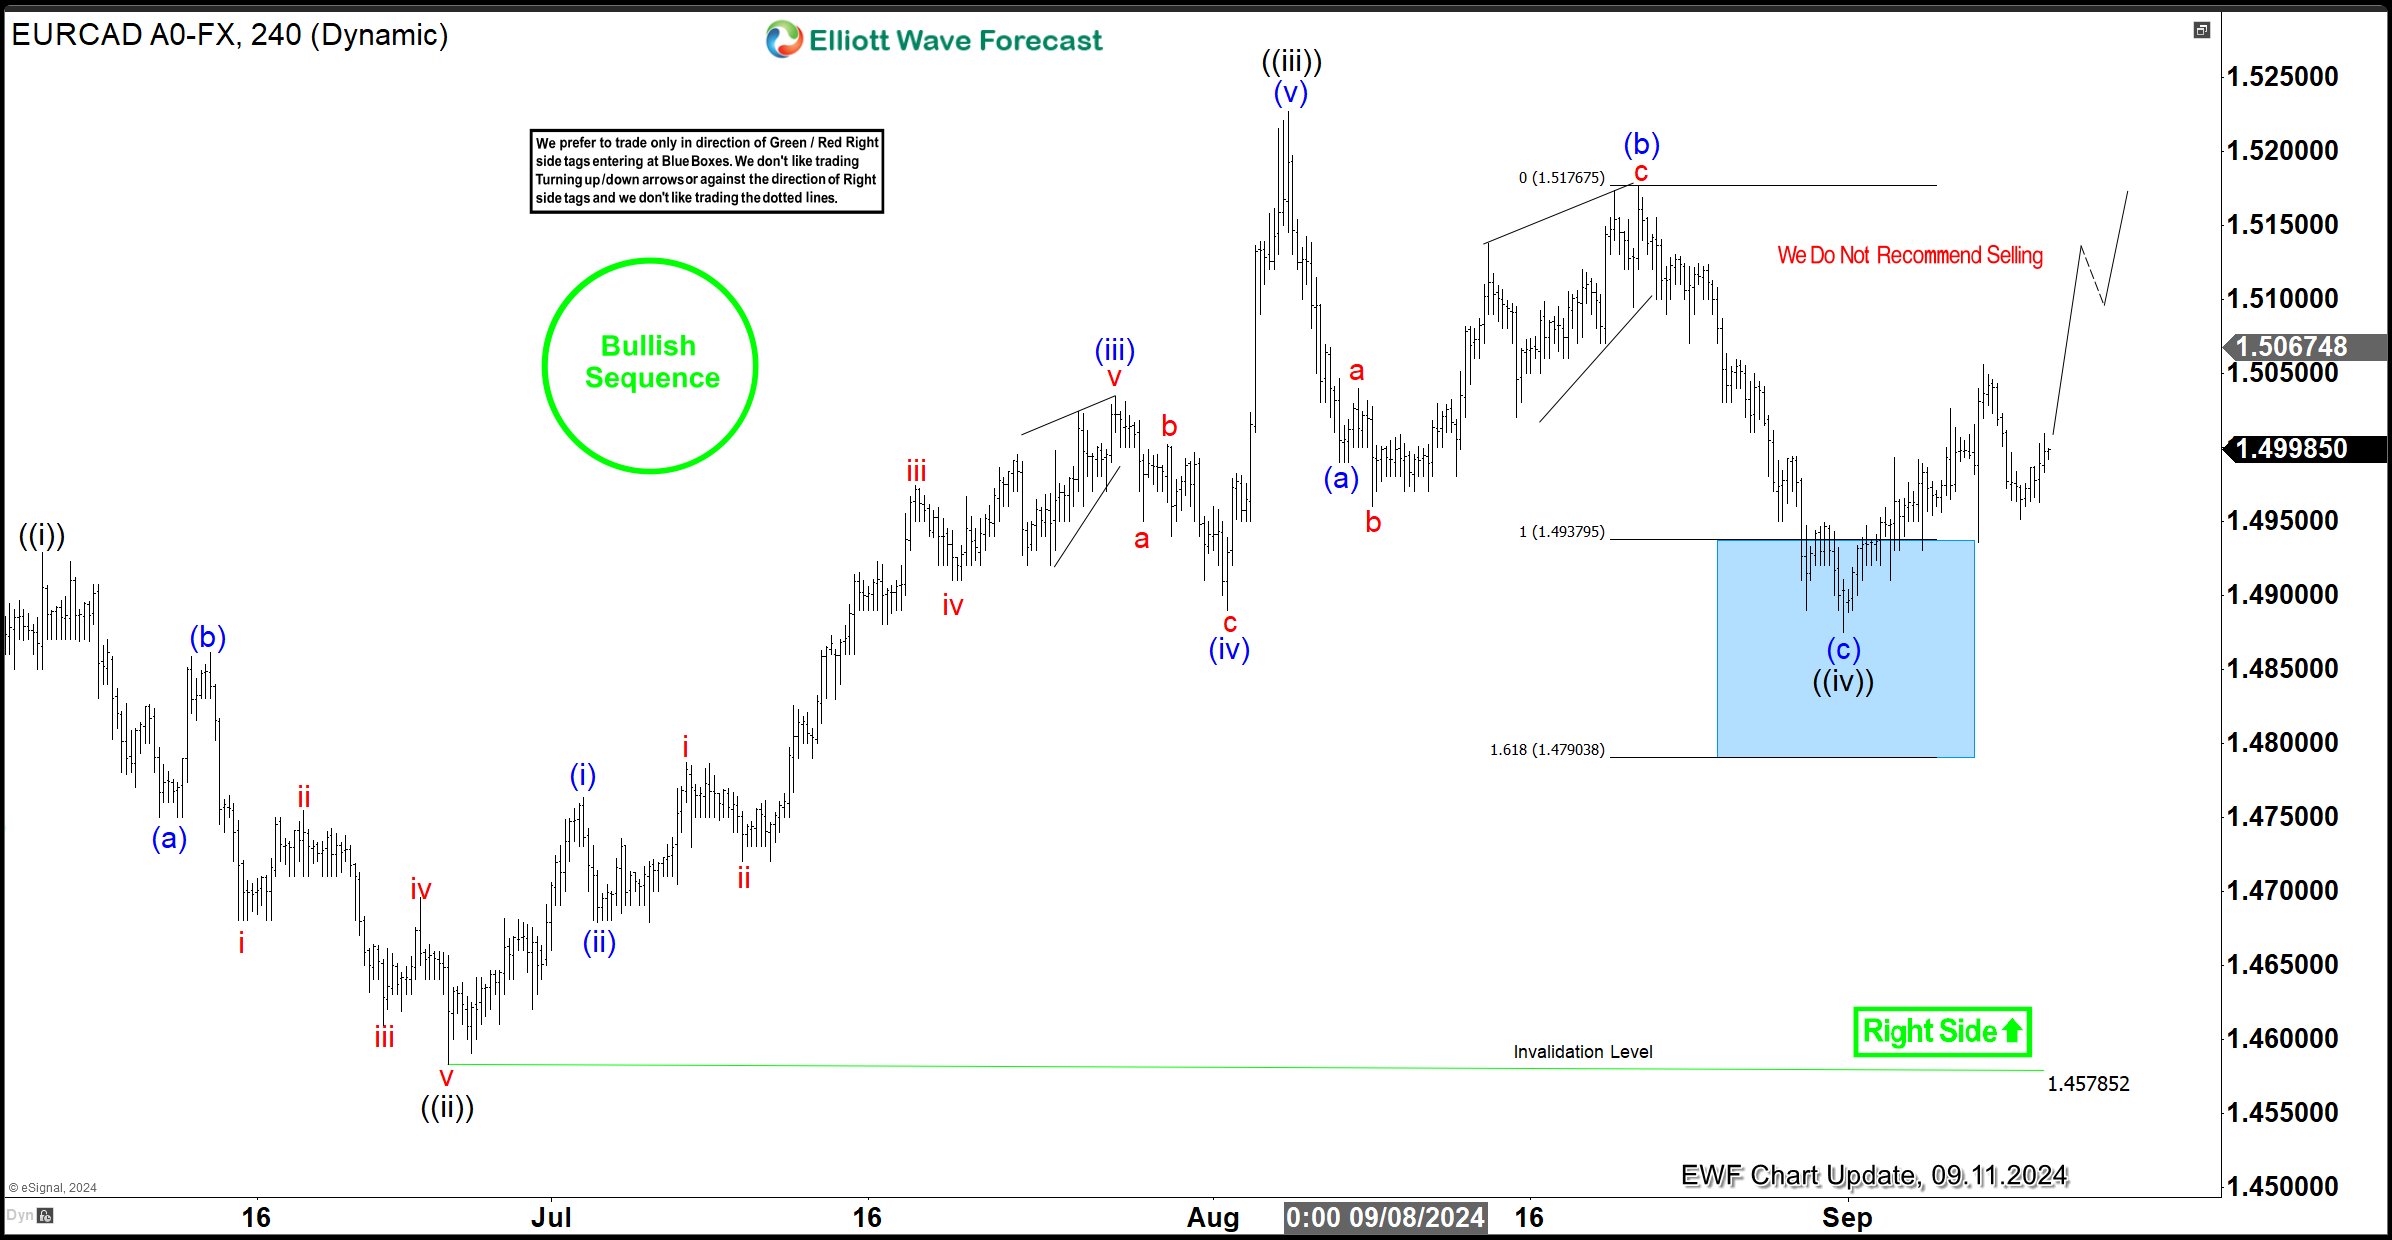
EURCAD H4 Analysis, 09.11.2024
The chart above shows how EURCAD bounced from the blue box and reached 50% of wave (c). As a result, members who went LONG have already closed half of their position in profit, with the remaining half adjusted to the low of wave (c). This is now a risk-free trade, allowing traders to allocate risk elsewhere. Moving forward, we expect the bullish sequence to extend as an impulse wave ((v)) above the August 5 high. Therefore, as long as the bullish sequence remains intact, we are looking to buy from the dips.