
- Major Wall Street indices started the week with gains, fueled by optimism for a “soft landing”.
- Concerns remain about the divergence between full and part-time workers, a potential recession indicator.
- Technical analysis suggests potential for further upside in the S&P 500 and Nasdaq 100, but historical trends and upcoming events warrant caution.
The major Wall Street Indexes have all started the week on the front foot, looking to recover some of Friday’s losses. There seems to be a fair bit of optimism today that a soft landing may be on the cards as US unemployment improved.
US equities experienced outflows last week which made it 3 out of the last 4 weeks. Money markets were the largest beneficiaries as fund flows and repositioning continue ahead of a busy couple of months.
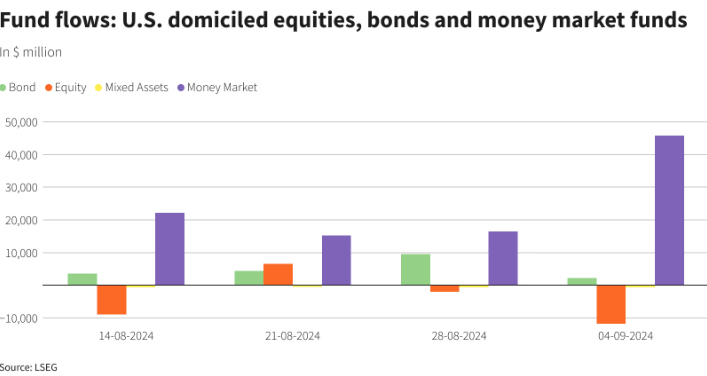
Source: LSEG Workspace
Despite the optimism around jobs data there are some underlying concerns which may be overlooked. A key one being the divergence between full and part-time workers which is widening. This phenomenon usually precedes a recession as indicated in a research note by ING think.
However, for now market participants are pricing in a 25 bps cut by the Fed at the September meeting. Concerning inflation data from China this morning was shrugged off with tomorrow’s import and export numbers likely to play a bigger role in the overall market sentiment.
Some individual movers in early trade today include Boeing BA.N which is up 4.7% after reaching a tentative agreement with a US Pacific NorthWest union. As the threat of a critical strike looms, this may go some way in mitigating such a disaster and could explain the jump in the share price. The union does represent 32k workers.
Dell and Palantir also enjoyed positive starts with the latter up around 8%. Dell was up around 5.9% on the day.
Nasdaq 100 Early Session Heatmap
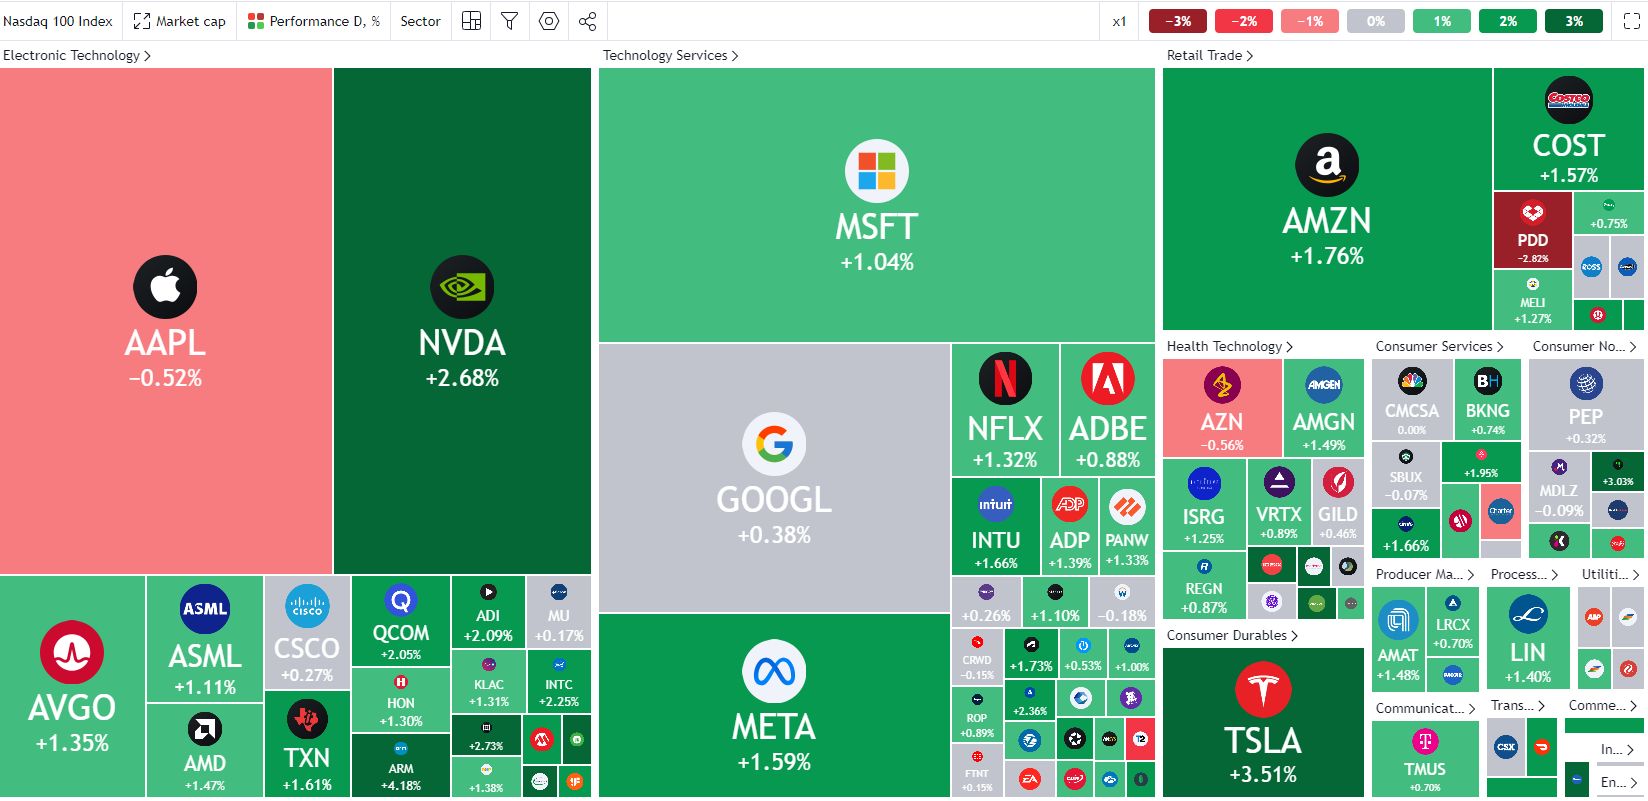
Source: TradingView
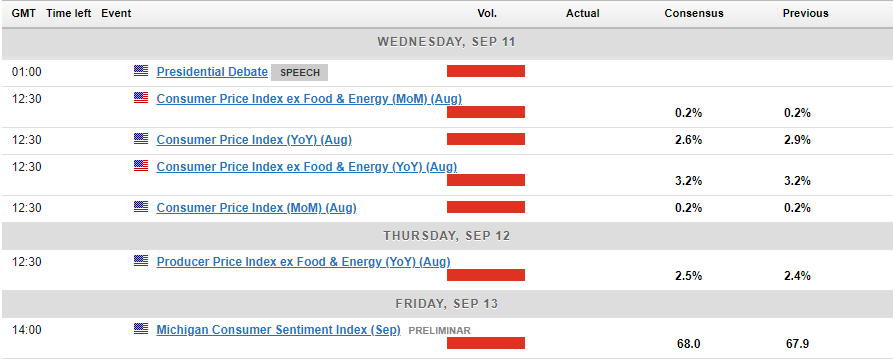
US PPI and CPI are ahead this week, however neither are likely to shake the needle where the Fed are concerned. Markets have for the time being at least pivoted toward labor data as the rate cut gauge rather than inflation.
Given the knowledge that September and part of October are historically bad for US stocks, was last week’s selloff as bad as it’s going to get? Or is there another selloff in store for market participants once the FOMC meeting concludes on September 18?
Technical Analysis
S&P 500
From a technical perspective, the S&P is coming off its worst week since March 2023 but has made an excellent start to the week. Finding support off a key level around 5390 (July 25 low), the index is on course for a bullish inside bar or engulfing candle close. Either of the two would hint at further upside ahead.
The headwinds presents are substantial however, and sentiment can always shift on a dime. Hence, marrying any bullish continuation bias at this stage may be premature. On the upside resistance is around the psychological 5500 before the 5538 handle comes into focus.
Immediate support rests at the 5390 mark before 5330 comes into focus. There is the 100-day MA that rests around the 5421 which could also provide some short-term support.
S&P 500 Daily Chart, September 9, 2024
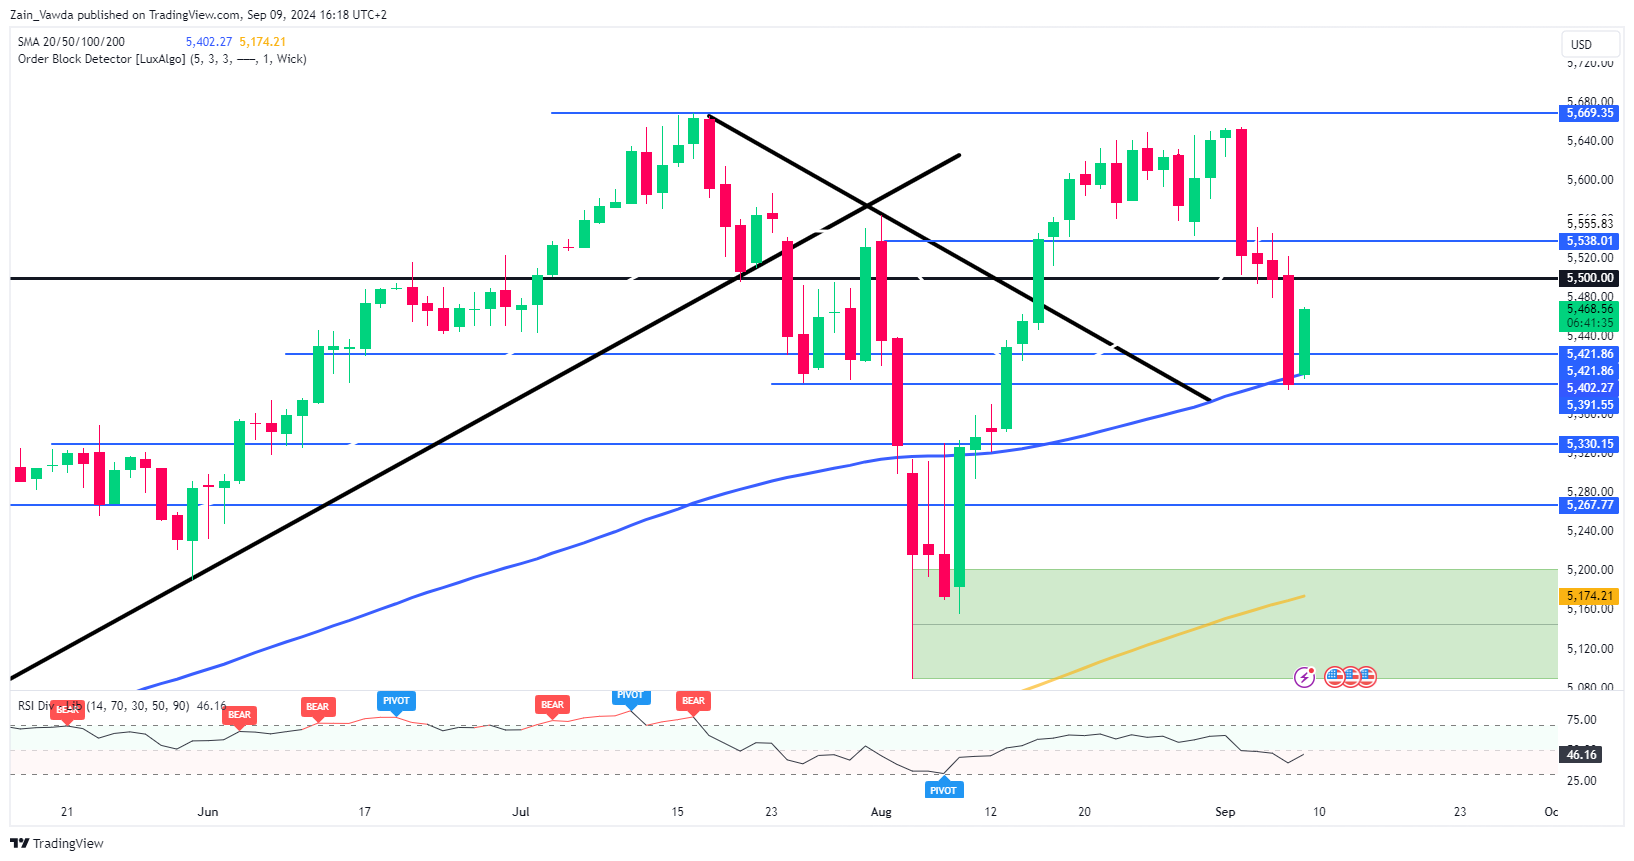
Source: TradingView (click to enlarge)
Support
- 5421
- 5390
- 5330
Resistance
- 5500
- 5538
- 5635
Nasdaq 100
From a technical perspective, the Nasdaq 100 on a daily timeframe is similar to the S&P as it has rallied over 330 points since the market open. We are seeing a slight pullback at the time of writing and given that historically September is a poor month for equities, we could be in for a bumpy ride.
There is a chance that rallies to the upside may face selling pressure and that the recovery may not be as smooth as market participants may hope for. Barring a dramatic collapse however, the Nasdaq 100 is on course to record a inside bar bullish close which hints at further upside ahead.
Having found support last week in between a key level and the 200-day MA which rests at 18241, there is significant hurdles up ahead which the index failed to clear on Friday. The first point of interest will arrive at 18800 before the confluence area around 19000 (which houses the 100-day MA) comes into focus.
Conversely, a break back to the downside would need to navigate below the 200-day MA before eyeing the 18000 level. This opens the door for a retest of the August lows around 17800 and 17330.
Nasdaq 100 Daily Chart, September 9, 2024
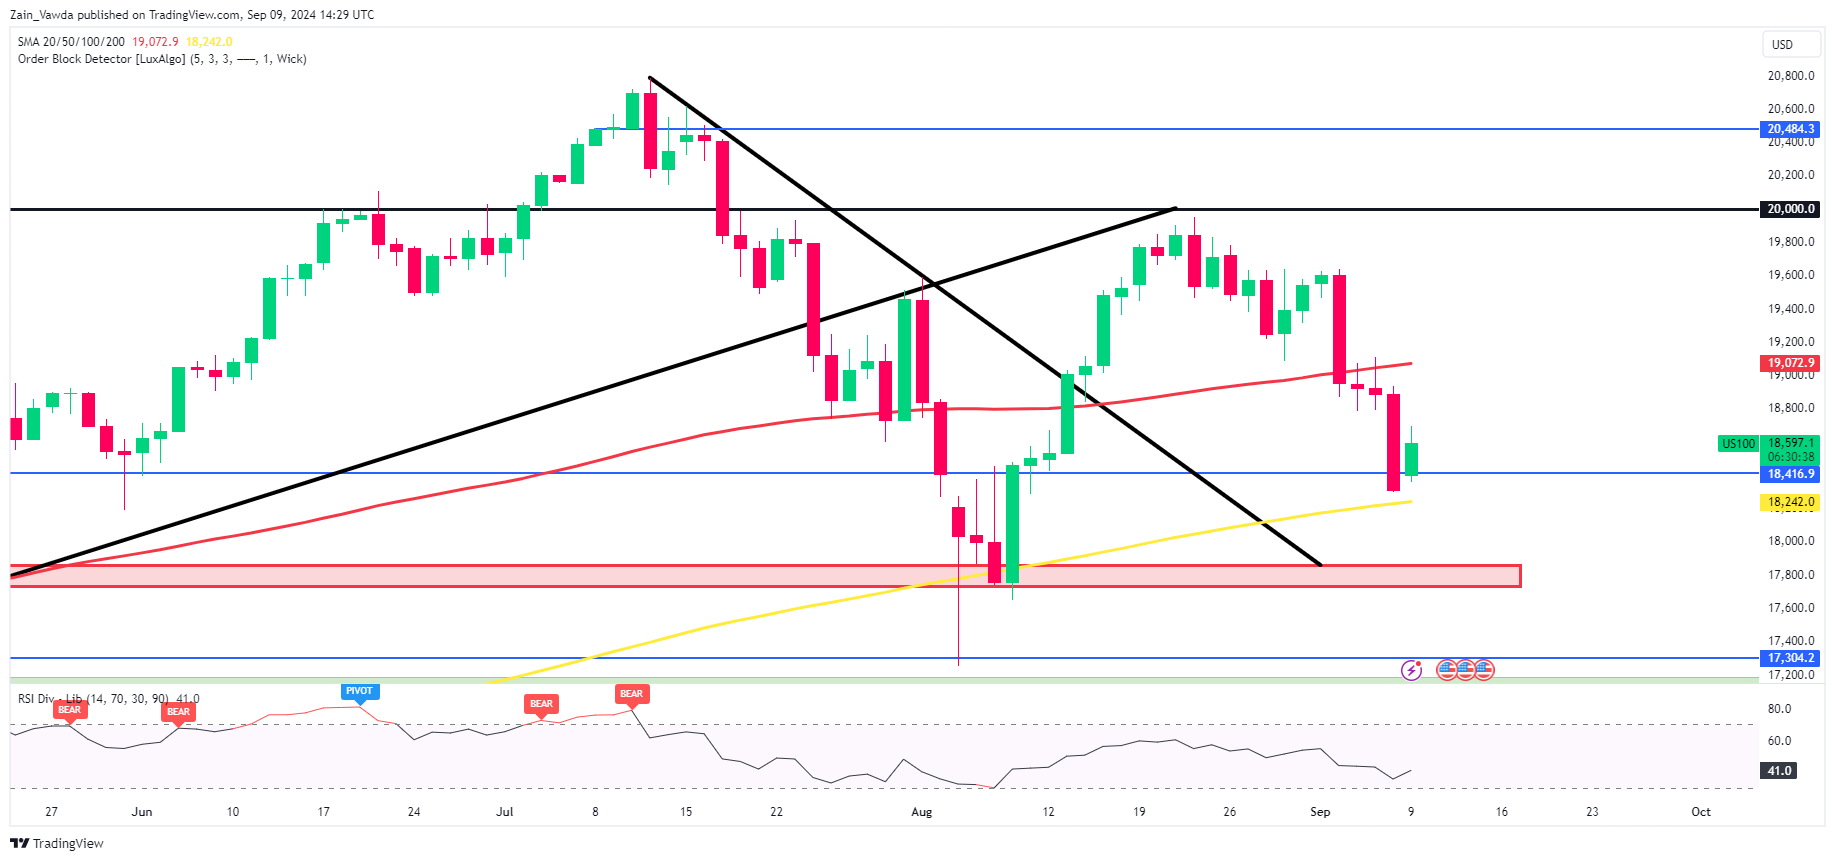
Source: TradingView (click to enlarge)
Support
- 18241
- 18000
- 17800
Resistance
- 18800
- 19000
- 19610