Investors expressed clear dissatisfaction with last week’s US non-farm payroll report, not much due to a miss in job growth expectations, but data left the size of the upcoming Fed rate cut unsettled, raising fears that Fed’s indecisive stance could worsen the already fragile economic outlook. In response, US equity markets ended the week sharply lower, with major indexes posting significant losses alongside a notable drop in the benchmark 10-year Treasury yield. The risk-off sentiment also spread to other markets, including oil and cryptocurrencies.
Yen was the clear winner of the week, registering broad-based gains fueled additionally by falling US and European bond yields. Meanwhile, there is increasing risk that the steep selloff in Japan’s Nikkei index and Yen’s rally could create a self-reinforcing cycle, with negative spillover effects for global markets.
Swiss Franc also benefited from the prevailing risk-averse sentiment, finishing as the second-strongest currency of the week. Euro rounded out the top three. At the other end of the spectrum, Australian Dollar was the worst-performing currency of the week. New Zealand Dollar followed behind, with Canadian Dollar also struggling amid weakening oil prices. In the middle of the pack, Dollar and British Pound ended with mixed performance.
Fed Policy Doubts Weigh on Stocks, S&P 500 and NASDAQ Suffer Significant Weekly Declines
After a brief rally on Friday following weaker-than-expected US employment data, US stocks reversed sharply and ended the week on a sour note. Investors re-evaluated the implications of the data for Fed’s policy path, and concerns grew that a cautious approach to rate cuts could lead to a more pronounced economic downturn. S&P 500 fell by -4.3% for the week, marking its worst performance since March 2023, while NASDAQ plummeted -5.8%, its steepest weekly drop since 2022. DOW followed suit, closed the week down by -2.9%.
The August non-farm payroll report showed weaker-than-expected job growth but didn’t definitively signal a 50bps rate cut for Fed’s upcoming meeting this month. On the positive side, the unemployment rate ticked down slightly, helping to calm immediate recession fears triggered by the Sahm rule. However, wage growth came in at 0.4%, a figure that remains high enough to fuel inflation concerns. Additionally, ISM services index indicated modest growth in the services sector, which continues to perform better than the manufacturing sector, now stuck in a prolonged recession.
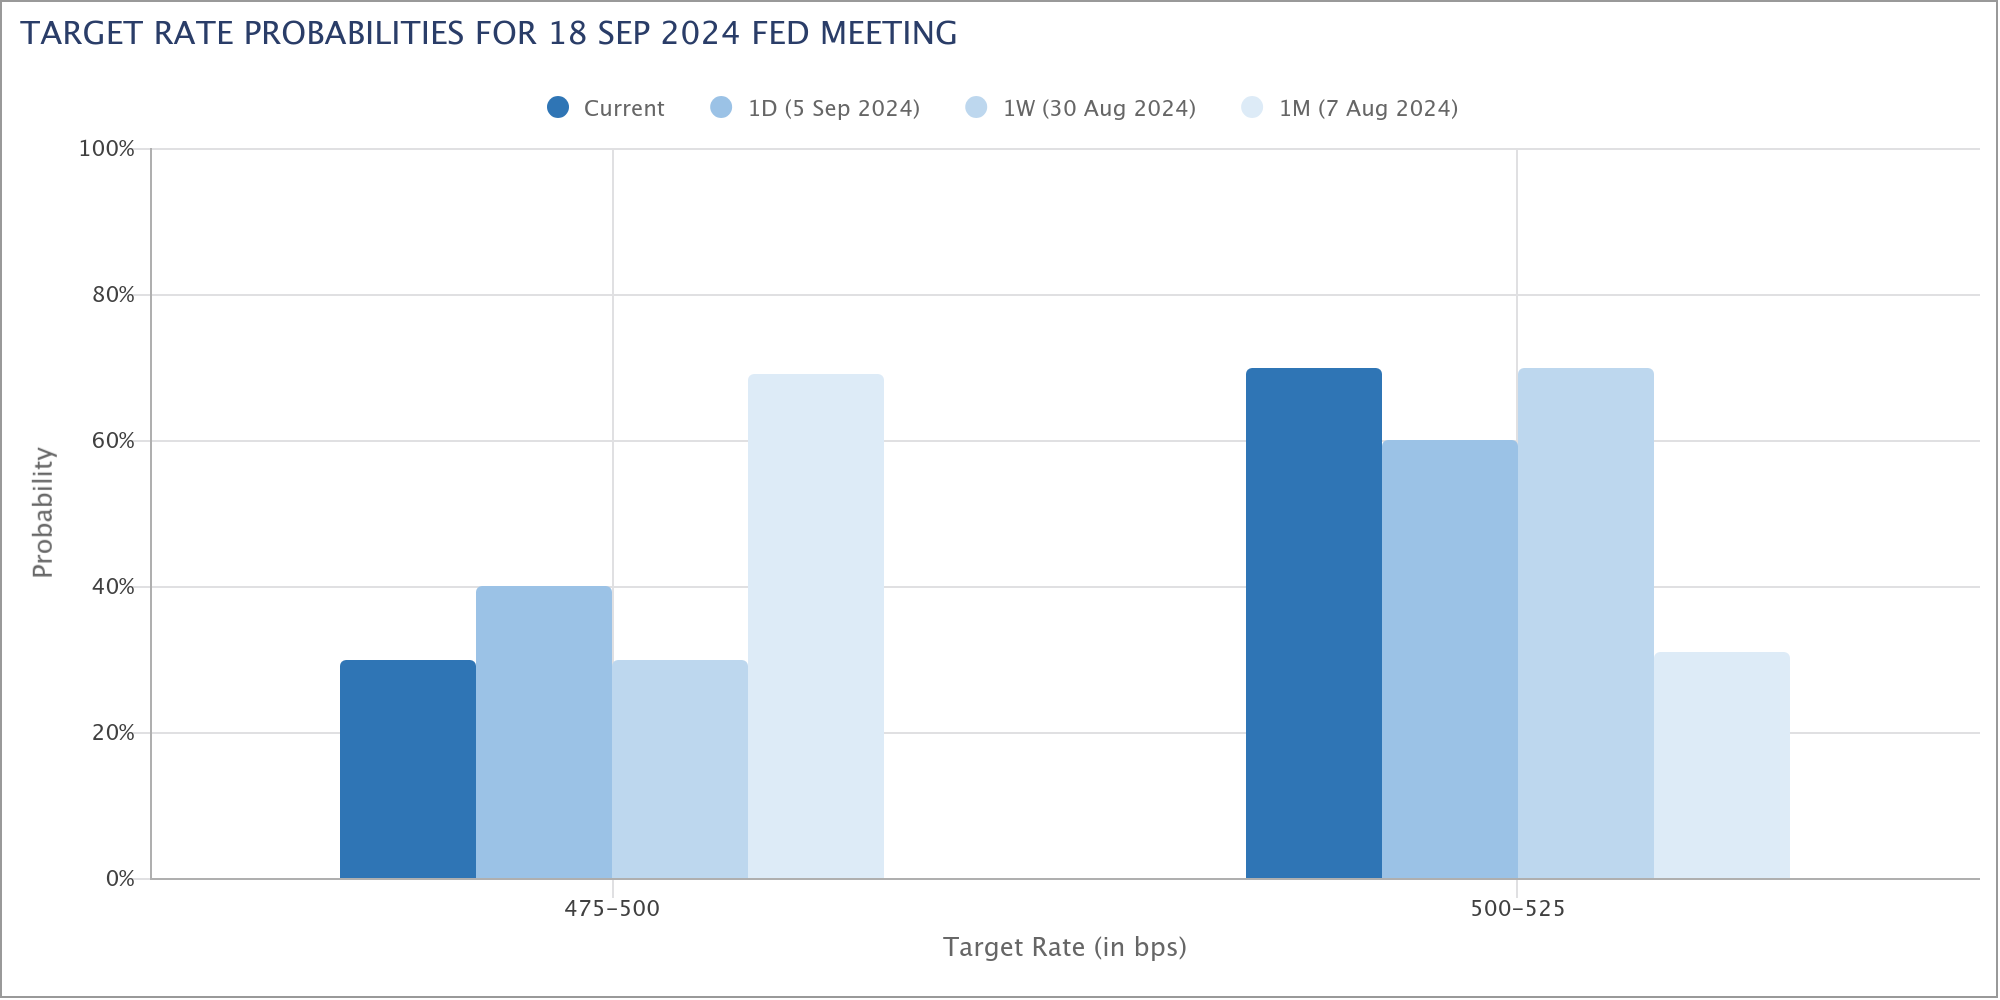
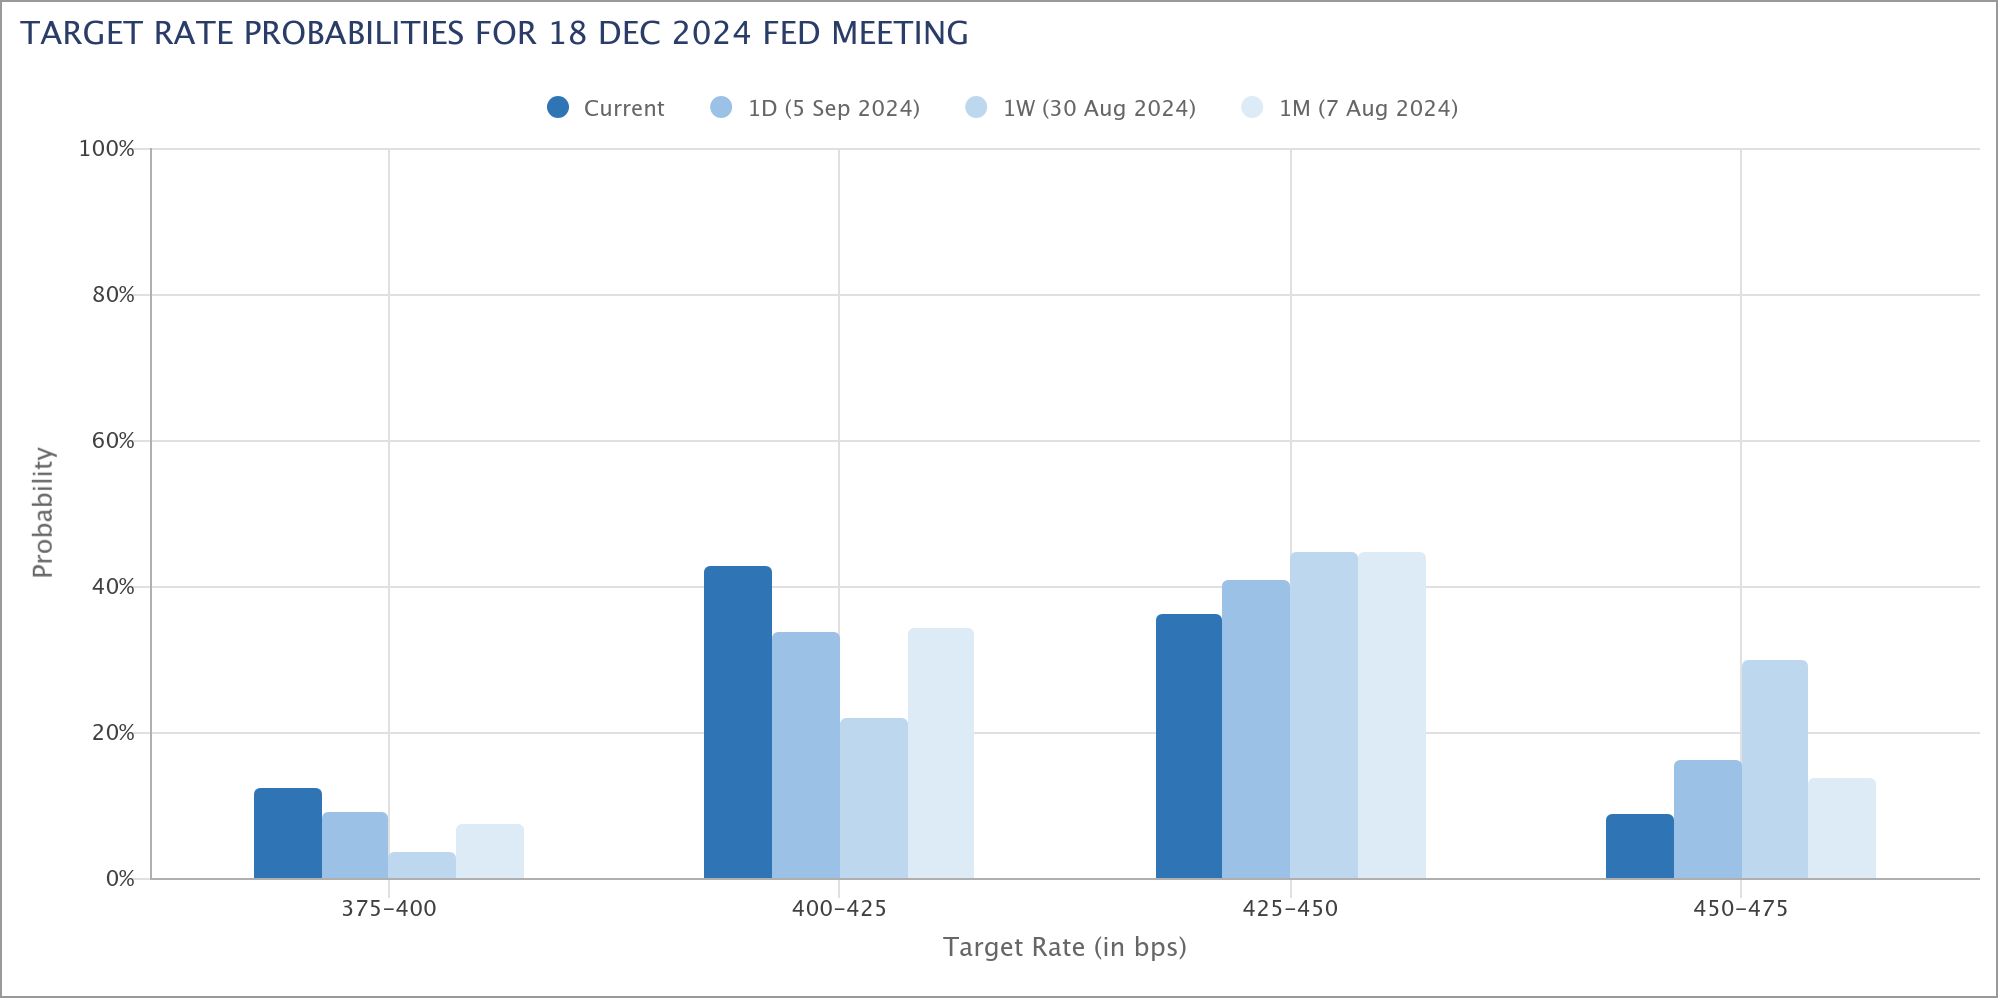
Initially, the odds of a 50bps rate cut spiked to above 50% following the NFP data, but by the end of the day, those odds had dropped back to 30%, unchanged from last week. However, markets have now priced in a 91.3% chance of a total 100bps cut by year-end, up significantly from 70% just a week ago. This suggests that while traders still expect rate cuts, they may foresee the Fed taking a more cautious, drawn-out approach rather than delivering aggressive action upfront.
Looking ahead, if upcoming CPI data surprises on the upside, Fed could face increased pressure to hold off on larger cuts, reinforcing the risk of a delayed but deeper economic downturn. A slower response from Fed may ultimately lead to more pronounced weakness in the labor market and broader economy, forcing the central bank to take stronger action, on at a later time.
Technically, S&P 500’s strong break of 55 D EMA (now at 5472.64) suggests that rebound from 5119.26 has completed at 5651.37. Corrective pattern from 5669.67 should have started the third leg. Without a close above 55 D EMA, risk will now stay on the downside for deeper fall back to 5119.26 support, or slightly further to 38.2% retracement of 4103.78 to 5669.67 at 5069.81.
Similar, but slightly more bearish, picture is seen in NASDAQ. Rebound from 15708.53 should have completed at 18171.68. Fall from there should be the third leg of the corrective pattern from 18671.06. Risk will stay on the downside as long as 55 D EMA (now at 17347.28) holds. Deeper decline should be seen to 15708.53 support, or possibly further to 100% projection of 1867106 to 15708.53 from 18171.68 at 15055.15.
US 10-year yield’s breach of 3.669 support late last week suggests that fall from 4.737, as well as that from 4.997, is resuming. Near term risk will now stay on the downside as long as 3.923 resistance holds. Next target is 100% projection of 4.997 to 3.785 from 4.737 at 3.525.
The question for 10-year yield is whether 3.525 could provide enough support to stabilize the decline. Or, TNX would need to dive further to 3.253 cluster support (38.2% retracement of 0.398 to 4.997 at at 3.240) before bottoming.
Dollar index continues to defend 100.61 key support level in indecisive price actions. The drag from falling yields was somewhat countered by risk-aversion on Friday, as DXY eventually closed at 101.17. For now, risk will stay on the downside as long as 102.16 support turned resistance holds. Firm break of 100.51/61 will resume whole fall from 107.34 to 99.57 (2023 low) next. That would also raise the chance of resuming whole down trend from 114.77 (2022 high).
Nevertheless, strong bounce from current level, followed by break of 102.16 will confirm short term bottoming and keep medium term outlook neutral for more sideway trading.
Nikkei Poised for Further Decline: Could Another Shockwave Hit Global Markets
The sharp drop in Japan’s Nikkei index is worth significant attention, especially considering the shockwave it sent through global markets in early August, when it plunged from 40k to 31k in just a few days.
Last week’s losses were particularly striking as they occurred even before the US stock market selloff, which followed the release of NFP data and the corresponding strong rally in Yen. Given this backdrop, Nikkei appears poised for further downside in the coming week.
Technically, Nikkei appears to have formed a short-term top at 39080.64, marked by a classic island reversal pattern. Immediate focus is now on 38.2% retracement of 31156.11 to 39080.64 at 36053.47. Decisive break there will argue that whole rebound from 31156.11 has completed and deeper fall would be seen to 61.8% retracement at 34183.28, and possibly below.
The next move in Nikkei will largely depend on the strength of Yen’s rally. AUD/JPY ended as the biggest mover last week, closing down -3.99%. The development suggests that rebound from 90.10 has completed at 99.82, after rejection by falling 55 D EMA. Deeper fall should be seen to 61.8% retracement of 90.10 to 99.82 at 93.75.
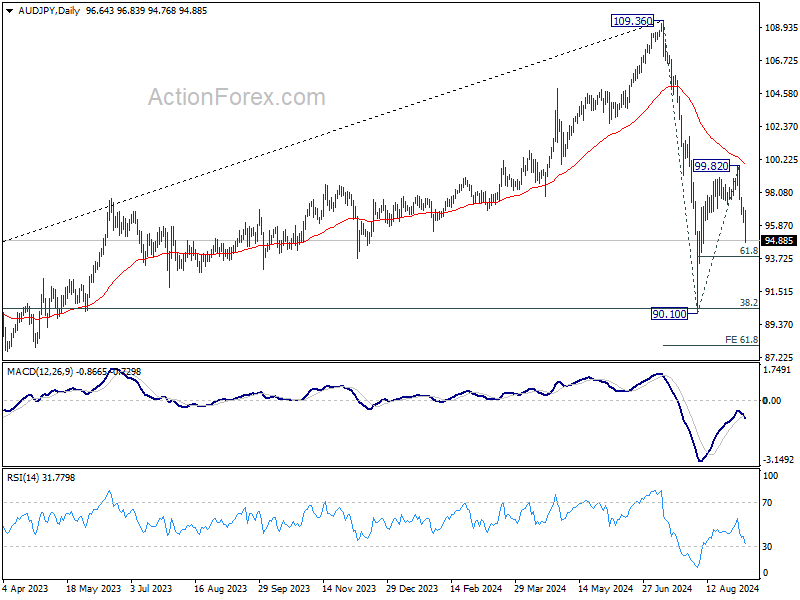
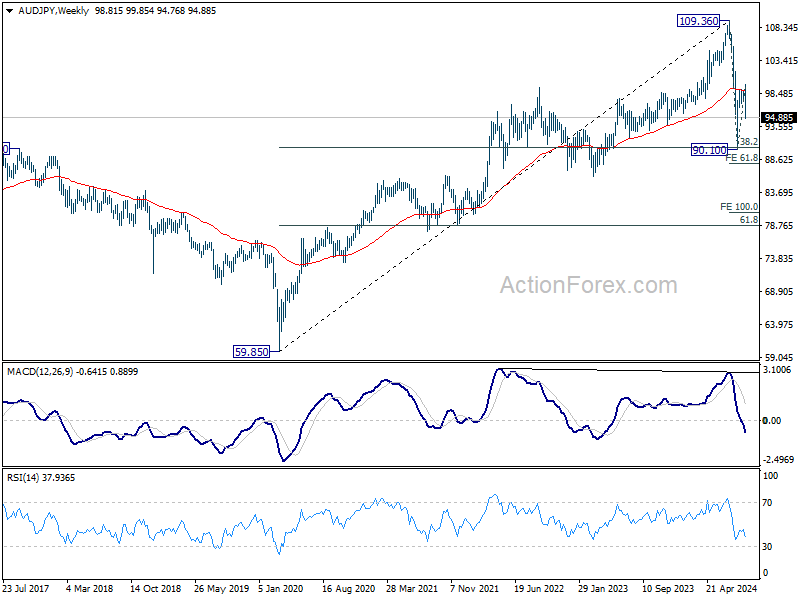
More importantly, AUD/JPY was also rejected by 55 W EMA, which could set up deeper medium term decline. Sustained break of 93.75 will raise that whole fall from 109.36 is resuming through 90.10 to 61.8% projection of 109.36 to 9010 from 99.82 at 87.91. If this bearish scenario is realized, that could probably mean a corresponding break of 31156.11 support in Nikkei, and intensification of risk aversion in the global markets.
WTI Oil and Bitcoin Point to Underlying Risk Aversion
In gauging overall risk sentiment ahead, some other markets would also be analyzed for confirmation of the overall direction.
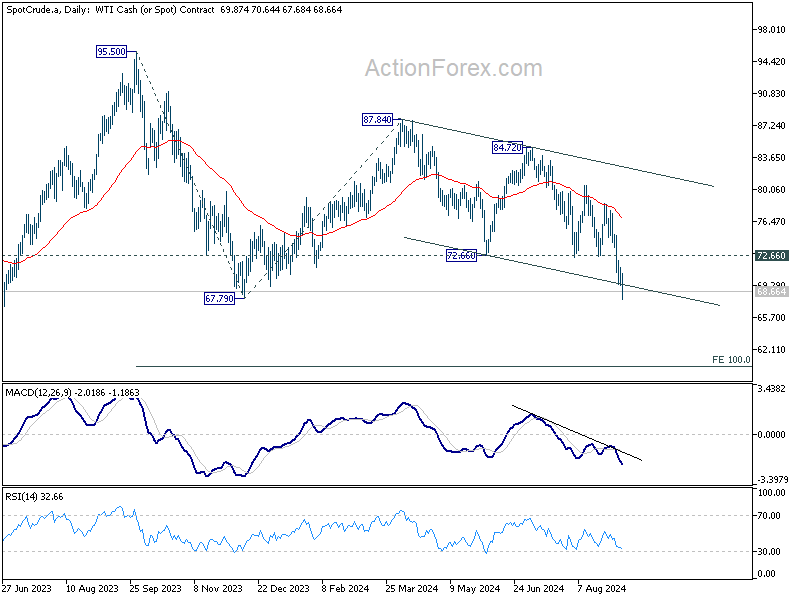
WTI crude oil suffered the worst weekly plunge since last October, and closed at the lowest level since June 2023. The fall came even with support factors like OPEC+ delayed plan to boost production until December. Traders were apparently more worried about the demand considering the global slowdown, in the US, Europe, as well as China.
Technically, WTI’s close below lower channel support suggests that the fall is probably accelerating. Near term outlook will stay bearish as long as 72.66 support turned resistance holds. The question is whether 63.67/67.79 zone could provide enough support to form a bottom. If not, WTI would then be extending the larger down trend from 131.82. Next target will be 100% projection of 95.50 to 67.79 from 87.84 at 60.13.
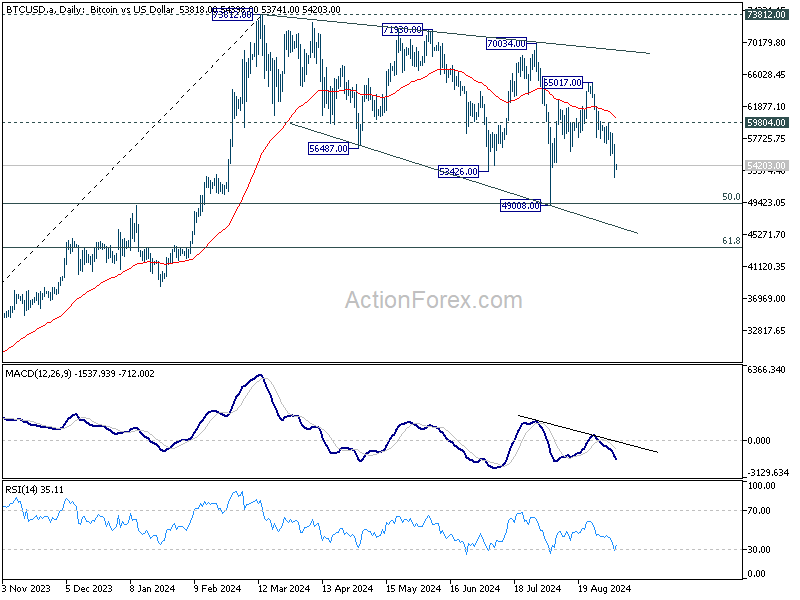
Bitcoin’s extended fall last week suggests that rebound from 49008 has completed at 65017 already. More importantly, corrective pattern from 73812 is now extending with another falling leg. Near term outlook will stay bearish as long as 59004 resistance holds. Next target is 49008 support. Firm break there will extend the correction to 61.8% retracement of 24896 to 73812 at 43581.
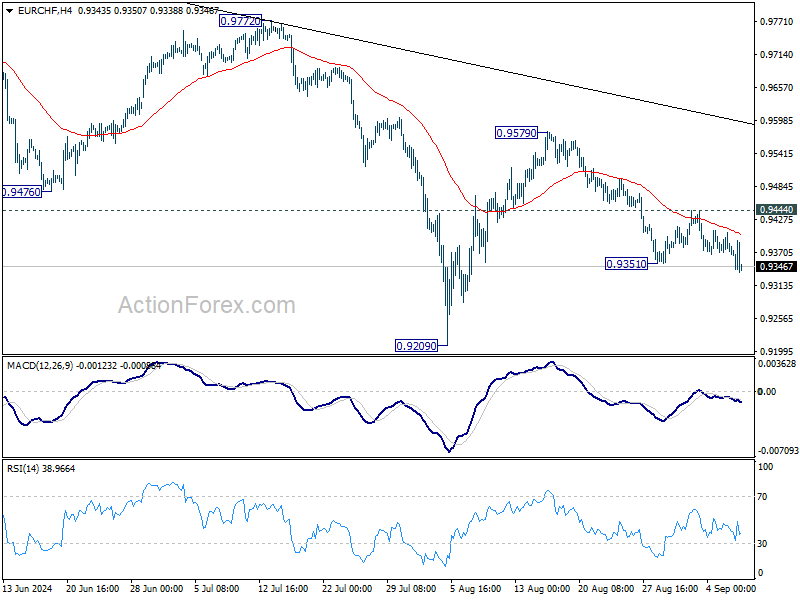
EUR/CHF Weekly Outlook
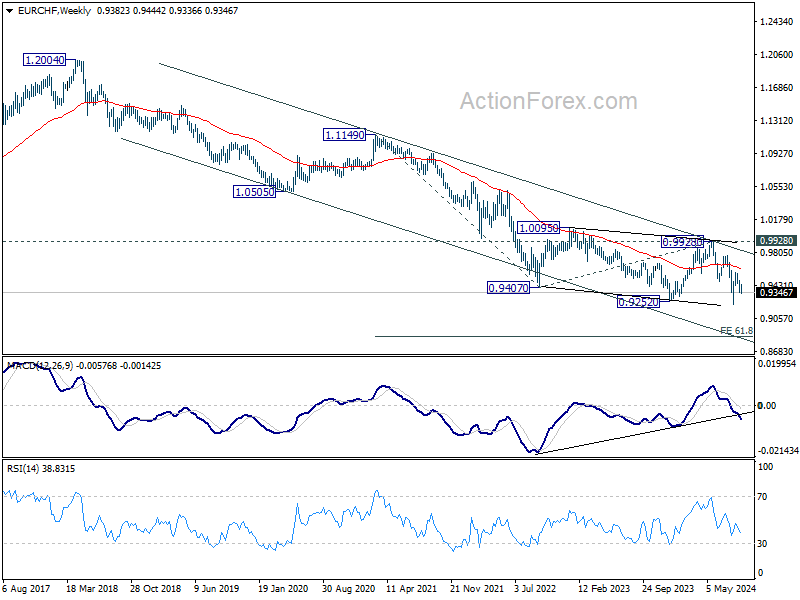
EUR/CHF’s fall from 0.9759 continued last week despite interim recovery. Initial bias is now on the downside this week. As noted before, rebound from 0.9209 should have completed at 0.9579, ahead of 55 D EMA. Deeper fall should be seen to retest 0.9209 first. Firm break there will resume larger down trend. For now, risk will stay on the downside as long as 0.9444 resistance holds, in case of recovery.
In the bigger picture, medium term corrective pattern from 0.9407 (2022 low) might have completed with three waves to 0.9928. Decisive break of 0.9252 (2023 low) will confirm long term down trend resumption. Next target will be 61.8% projection of 1.1149 to 0.9407 from 0.9928 at 0.8851. For now, outlook will stay bearish as long as 0.9928 resistance holds, even in case of strong rebound.
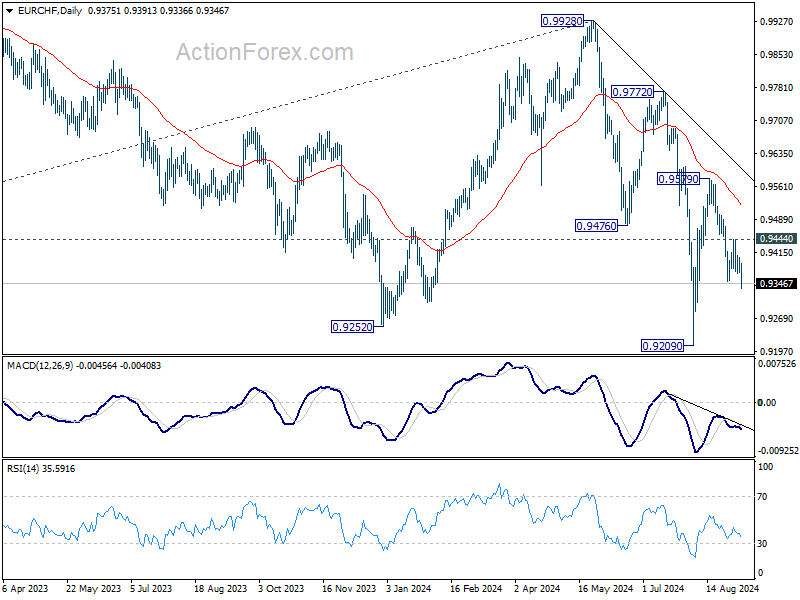
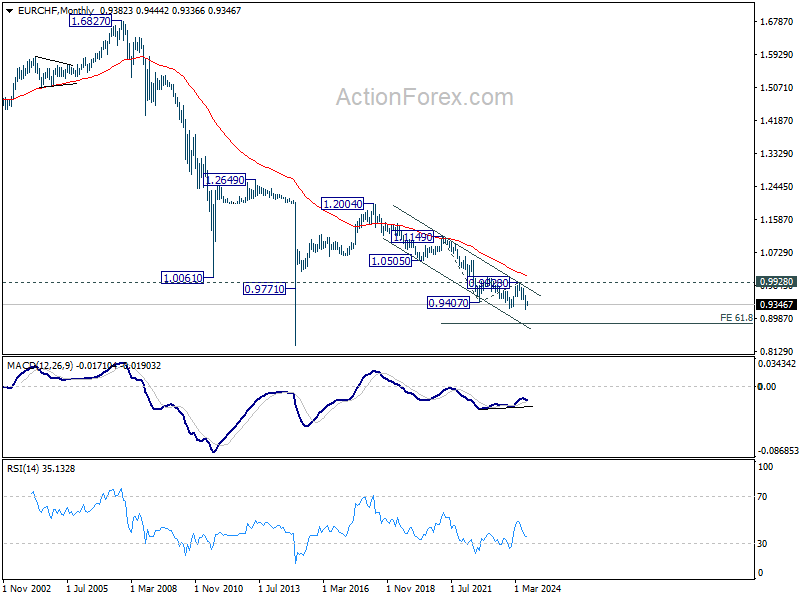
In the long term picture, fall from 1.2004 (2018 high) is part of the multi-decade down trend. Firm break of 0.9928 resistance is needed to be the first sign of long term bottoming. Otherwise, outlook will remain bearish.