
- The recent 7.4% rally in the AUD/USD from its 5 August 2024 low has been driven by a resurgence of risk-on behaviour and the US Fed’s dovish pivot.
- Weak China’s manufacturing PMI data and housing market are likely to be in the driving seat now to potentially dictate the sentiment of the AUD/USD.
- Further weakness in Iron Ore futures prices may trigger a negative feedback loop into AUD/USD.
- Watch the key medium-term resistance of 0.6900 on the AUD/USD with intermediate supports at 0.6700 and 0.6600.
After the global risk-off episode that occurred from mid-July to 5 August, the Aussie dollar has managed to recover all its losses against the US dollar in the same period.
The AUD/USD, being a higher-beta play among the FX majors rose by 7.4% from its 5 August low of 0.6348 to print a recent high of 0.6824 on 29 August reinforced by a clear switch of monetary policy stance by the US Federal Reserve from “hawkish-higher for longer” to “dovish-time has come for policy to adjust” ex-post Fed Chair Powell’s 23 August Jackson Hole Symposium speech that cemented a potential upcoming 25 basis points cut to the Fed funds rate on the 18 September FOMC meeting.
Weak macro data from China is in the limelight again
The latest China NBS Manufacturing PMI data for August has pointed to a fourth consecutive month of contraction in manufacturing activities, it slipped further to 49.1 from 49.4 in July, below the consensus of 49.5.
Its new orders subcomponent declined at a slightly higher magnitude from 49.30 in July to 48.90 in August which is an alarming cause of concern as a significant portion of China’s economic growth so far in 2024 has been driven by external demand and top policymakers’ heavily allocation of state resources towards China’s high tech industrialization programme.
If China’s manufacturing activities languish at this rate in Q4, it is unlikely that China can meet its 5% annualized economic growth target for 2024. In addition, a weak state of manufacturing production coupled with the housing market in China that is still not showing any clear signs of stabilization from a persistent trend of negative growth rates (value of new-home sales from the 100 biggest real estate firms plunged to 26.8% y/y in August from -19.7% in July), there is likely less demand for industrial metals such as iron ore.
Iron ore prices have moved in direct lockstep with AUD/USD
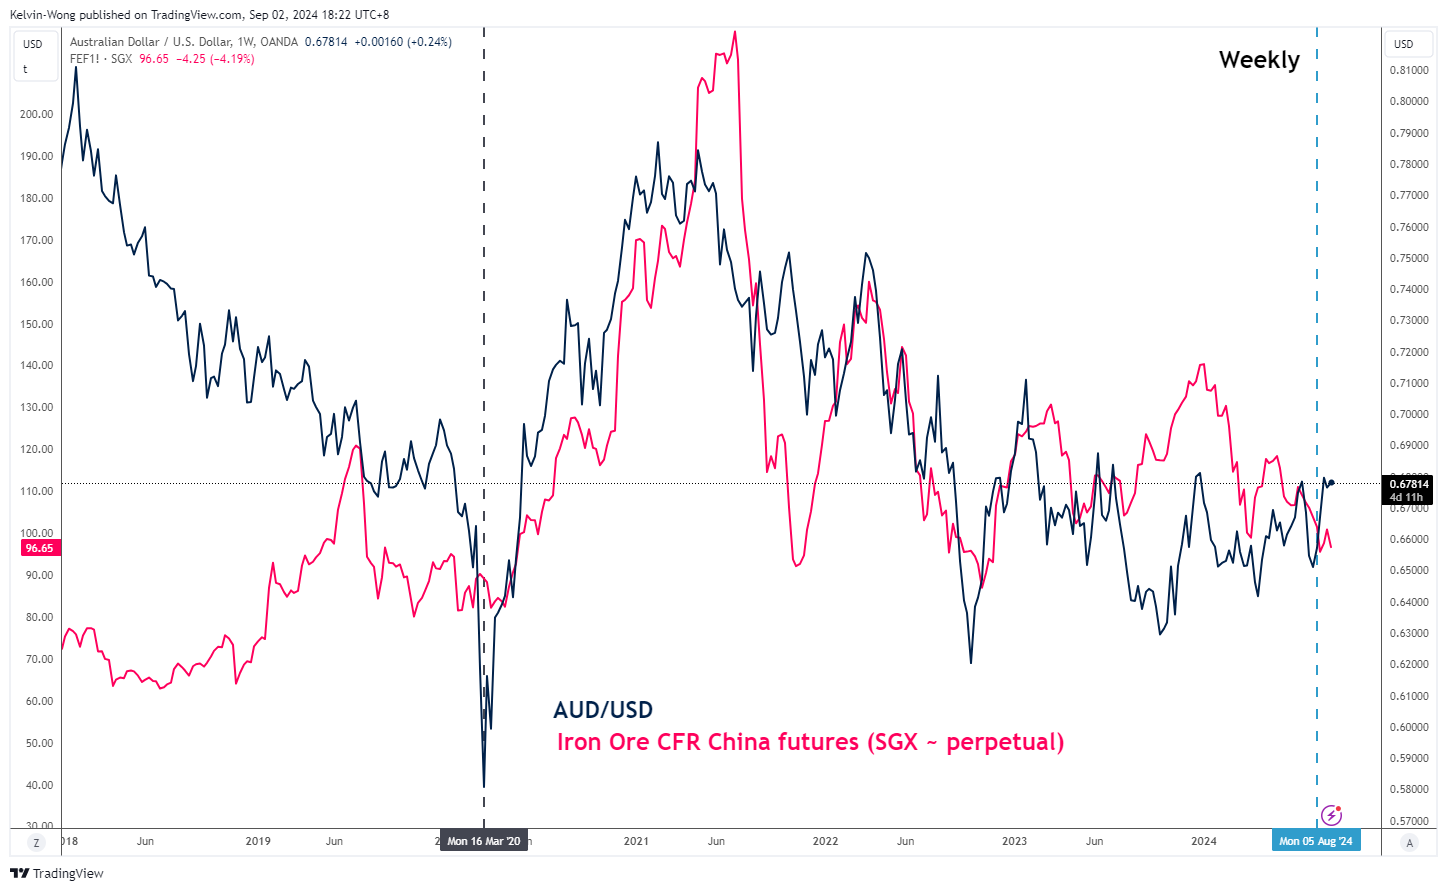
Fig 1: AUD/USD & Iron Ore futures correlation movement as of 2 Sep 2024 (Source: TradingView, click to enlarge chart)
Given that iron ore is one of Australia’s key resource exports and a significant portion of it goes to China; if China’s economic growth languishes, there will be likely less demand for iron ore, in turn, put downside pressure on Australia’s trade balance that may trigger a negative feedback loop into the AUD/USD.
Since March 2020, the movement of the Iron Ore CFR China futures contract listed on the Singapore Exchange has a positive correlation with the AUD/USD. However, this positive correlation flipped to negative for a short period recently from 5 August to 29 August due to the resurgence of global risk-on behaviour (see Fig 1).
Given that China’s lacklustre economic growth narrative is back on the radar screen again, the Iron Ore CFR China futures contract (SGX) has declined by -4.2 % today at this time of the writing, its longer-term positive correlation movement with AUD/USD may come back to influence the movement of the Aussie dollar.
AUD/USD rally has almost reached its 0.6900 major resistance
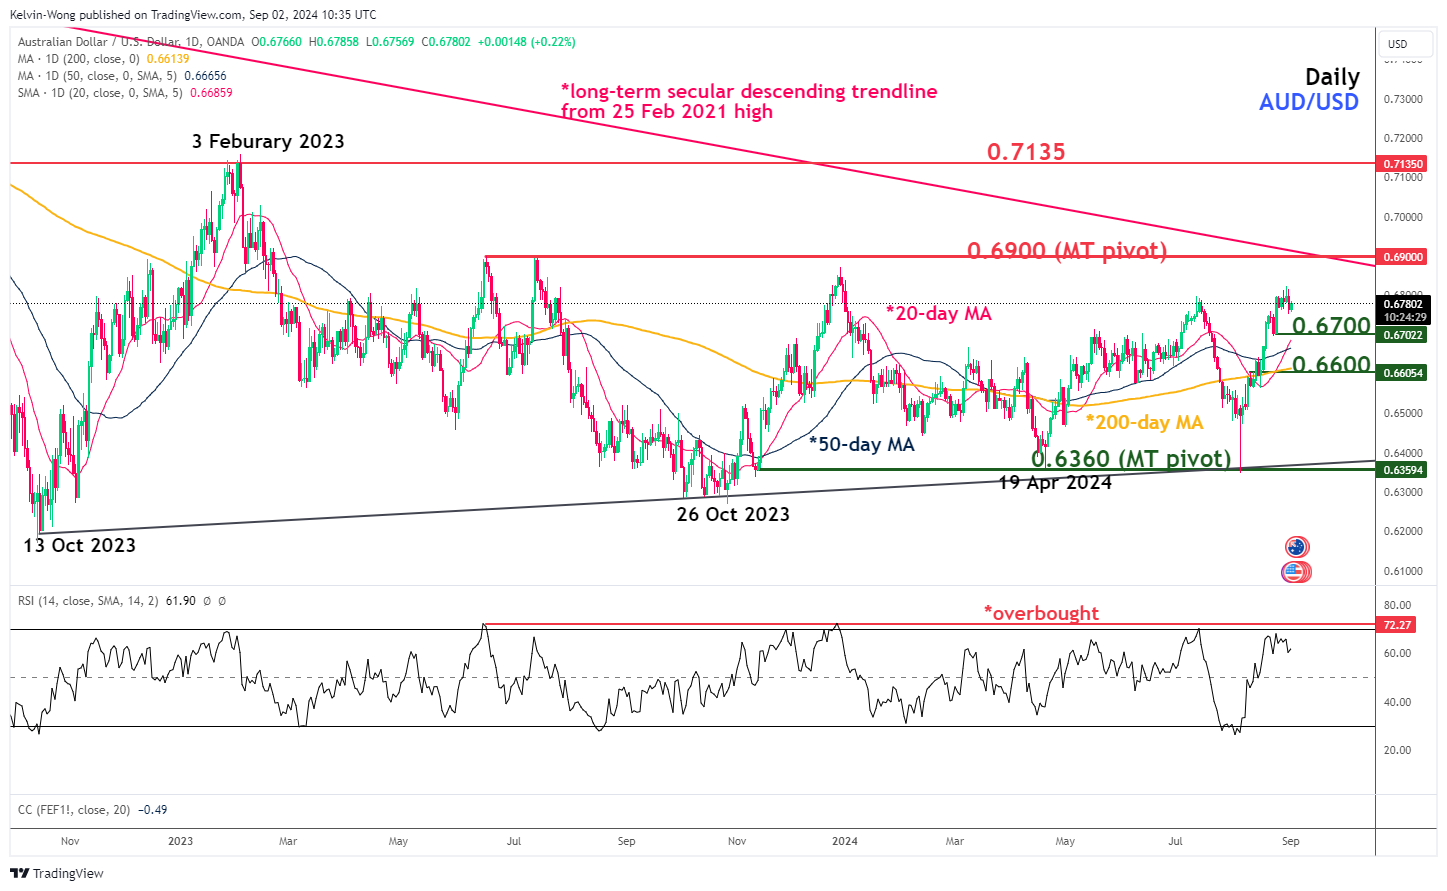
Fig 2: AUD/USD major & medium term trends as of 2 Sep 2024 (Source: TradingView, click to enlarge chart)
The recent rally of 7.4% from its 5 August low seen in AUD/USD has now almost reached a major resistance of 0.6900 (the medium-term swing highs of 16 June/13 July 2023 and long-term secular descending trendline from 25 February 2021 high).
In addition, the daily RSI momentum indicator has almost hit an overbought level of 72 which has capped prior advances of the AUD/USD since 15 June 2023.
If the 0.6900 key medium-term pivotal resistance is not surpassed to the upside, the AUD/USD may see a mean reversion decline scenario unfolding to expose the next intermediate supports at 0.6700 and 0.6600 (also the 200-day moving average) (see Fig 2).
However, a clearance above 0.6900 invalidates the bearish scenario on the AUD/USD for the next intermediate resistance to come in at 0.7135.