
, setting the stage for a fourth consecutive month of growth.)
- Gold prices hover around $2500/oz as the DXY strengthens, with markets awaiting key data amidst geopolitical tensions.
- Gold ETFs see continued inflows, marking a fourth consecutive month of gains, signaling sustained investor interest.
- Technical analysis reveals a bearish triangle pattern on the Gold chart, suggesting a potential price decline.
Gold prices have returned to $2500/oz as the DXY started the day strong. Geopolitical tensions have taken a backseat while markets anticipate this week’s data. Gold ETFs experienced modest inflows last week, continuing a trend that began in May, with inflows totaling around 8 metric tonnes ($403 million), setting the stage for a fourth consecutive month of growth.
Market participants are closely watching Nvidia’s earnings release later today, which could spark volatility and influence broader markets. Additionally, the upcoming PCE data on Friday could be pivotal in determining gold’s trajectory by the week’s end.
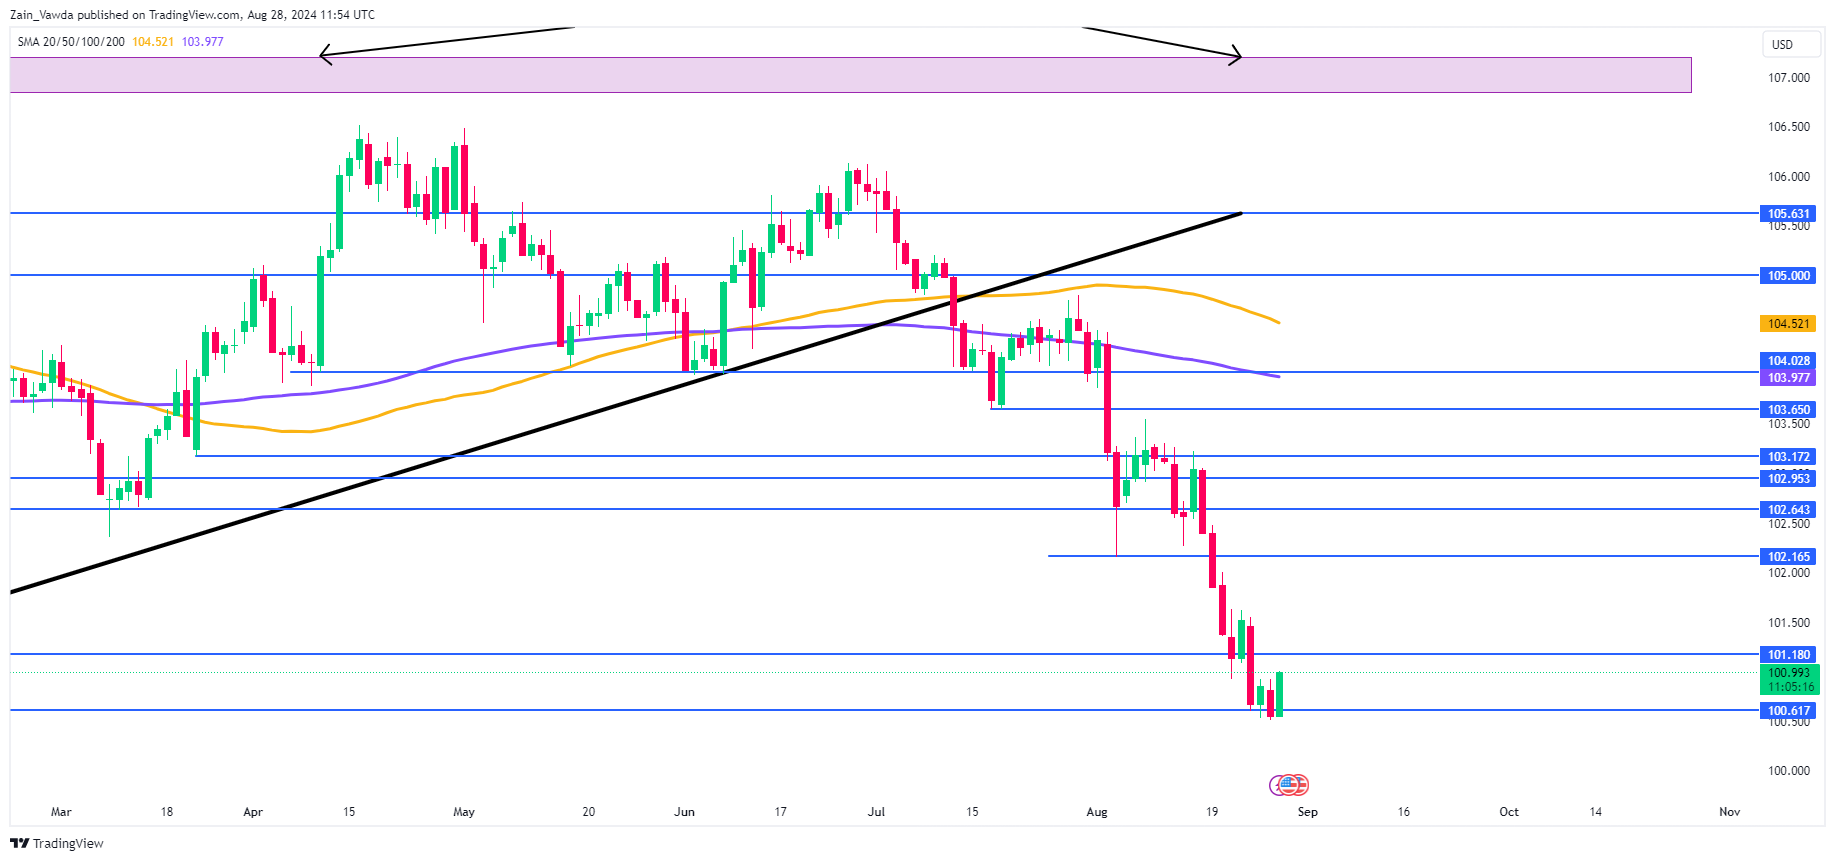
The rally in the US Dollar this morning could be attributed to various factors, including end-of-month re balancing by investors. With expectations of 100 bps in rate cuts, the question arises: Have these cuts already been priced into the market?
US Dollar Index Daily Chart, August 28, 2024
Source:TradingView
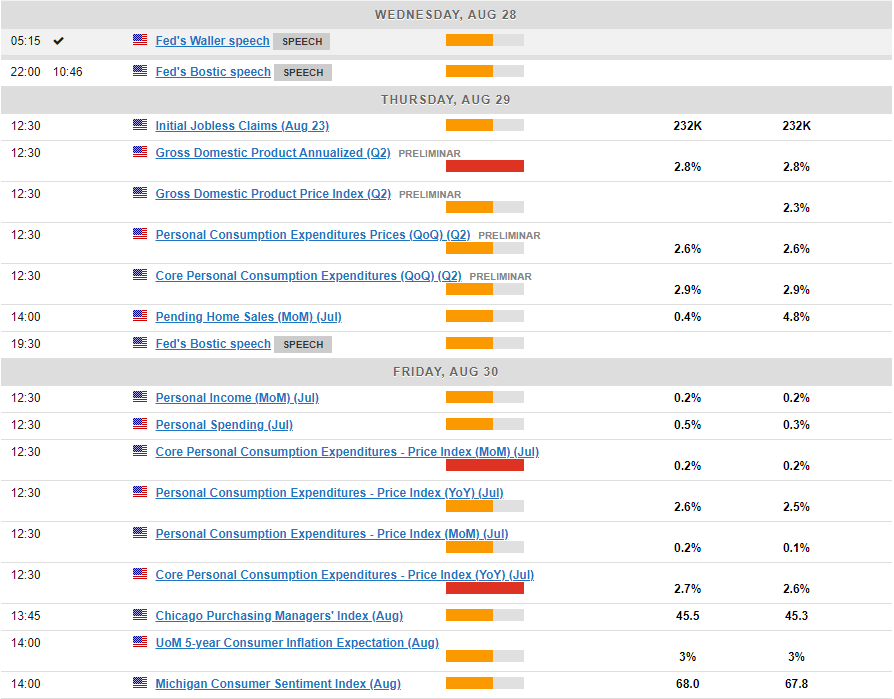
On the data front, it’s another quiet day for US economic data with the highlight being comments from Federal Reserve policymaker Rafael Bostic. It will be interesting to gauge where the Atlanta Fed President stands regarding a potential 50 bps rate cut in September.
Any hint that Bostic is in favor of a 50 bps cut could add to the dollar’s woes and likely lead to a renewed selloff. Whether this will last however remains to be seen given the US data on Thursday and Friday.
Technical Analysis Gold (XAU/USD)
From a technical perspective, the four-hour Gold chart is currently noteworthy. During the US session yesterday, Gold surged close to its all-time high and appeared set to climb further overnight as the Dollar Index weakened.
However, this morning witnessed a rebound in the US Dollar, which has contributed to a $30 decline in Gold prices, bringing them back to the $2500/oz level.
The H4 chart reveals an intriguing triangle pattern that has decisively broken to the downside. This breakout suggests a potential $60-$70 decline in gold prices, targeting support near the $2440/oz mark according to the pattern’s guideline.
Nonetheless, geopolitical risks remain a concern, as previous technical patterns have failed to manifest as expected for this precious metal. Will this instance prove to be different?
GOLD (XAU/USD) Four-Hour (H4) Chart, August 28, 2024
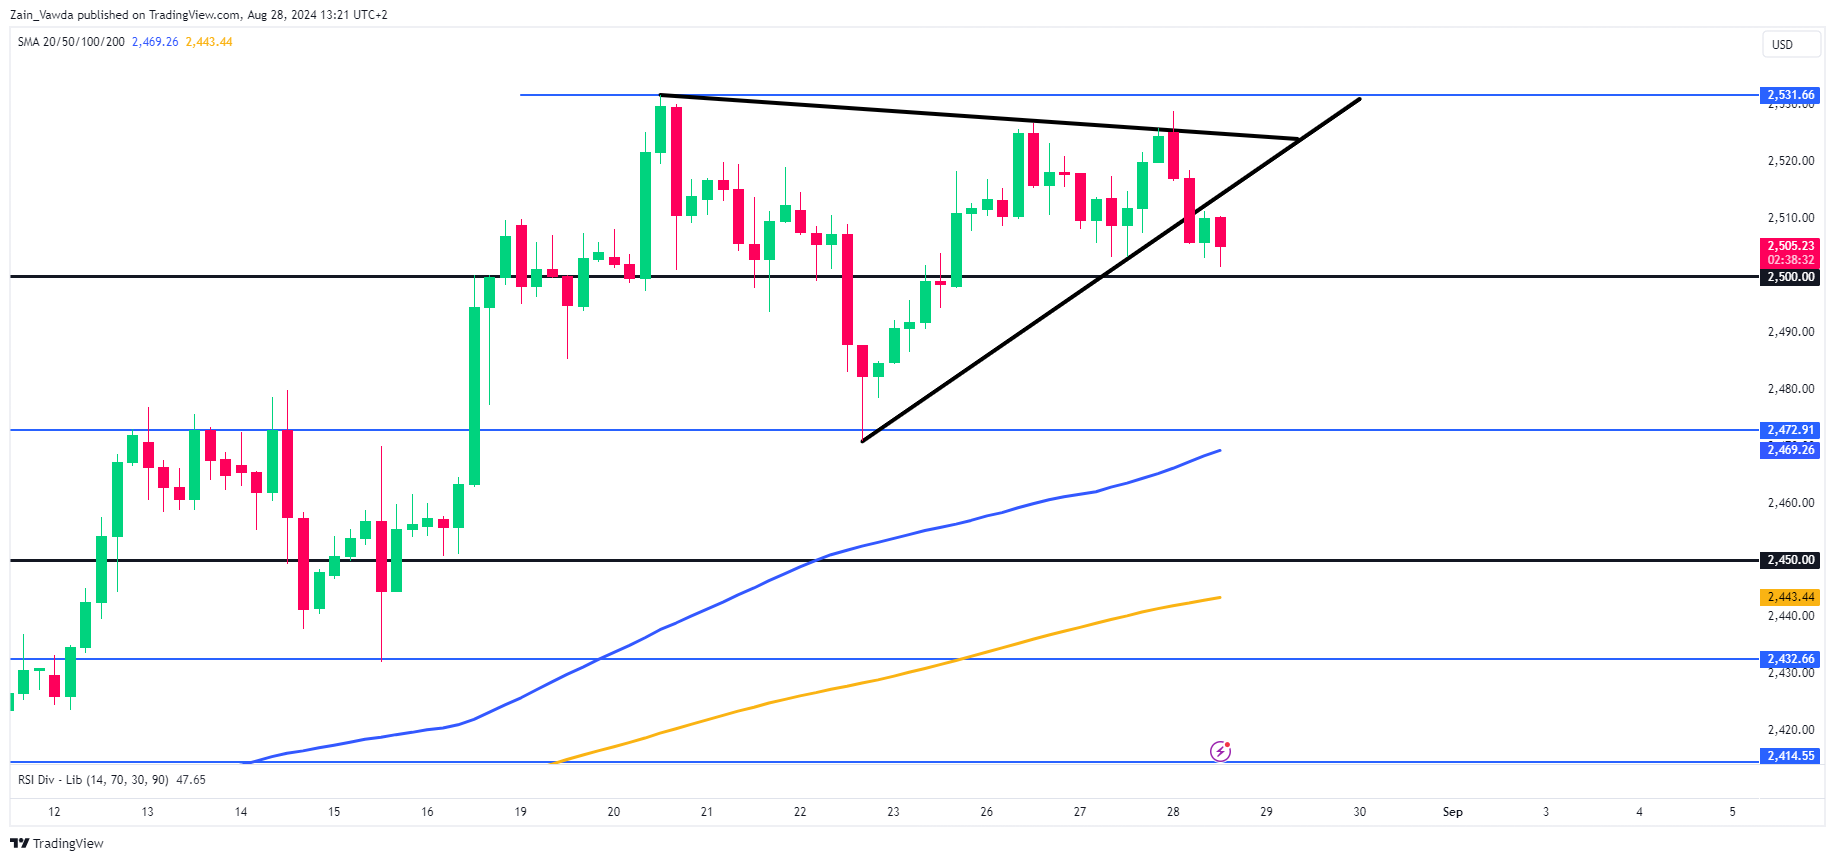
Source: TradingView (click to enlarge)
Support
- 2484
- 2472
- 2450
Resistance
- 2514
- 2531.66
- 2550