
- Bearish Scenario: Sell positions below 2470 with TP1: 2463, TP2: 2460, TP3: 2456 intraday, with a stop loss above 2473 or at least 1% of the account capital.
- Bullish Scenario: Buy positions after a pullback above 2460 with TP1: 2470, TP2: 2480, and TP3: 2490 in extension. Stop loss below 2450 or at least 1% of the account capital. Apply Trailing Stop.
Technical Analysis
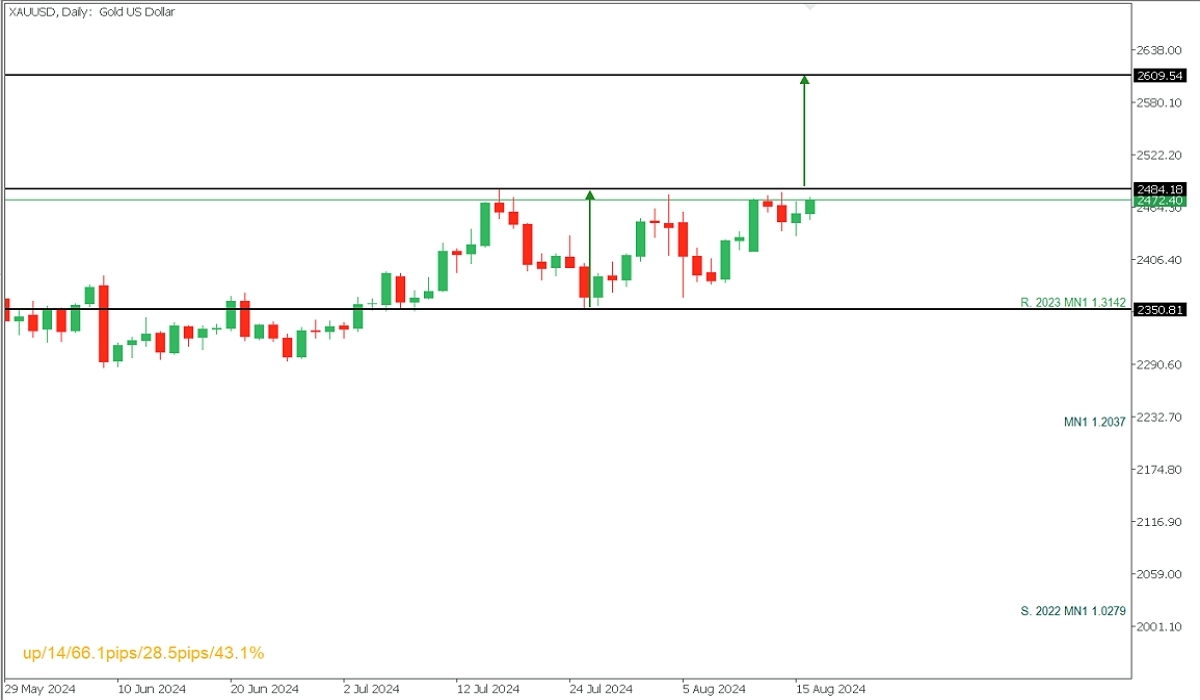
XAUUSD, Daily
On this timeframe, price consolidation is observed below the July resistance and current all-time high, forming a bullish cup and handle structure. This suggests a continuation of buying pressure in the short term with profit targets at 2500, 2600, and 2609 at 100%.
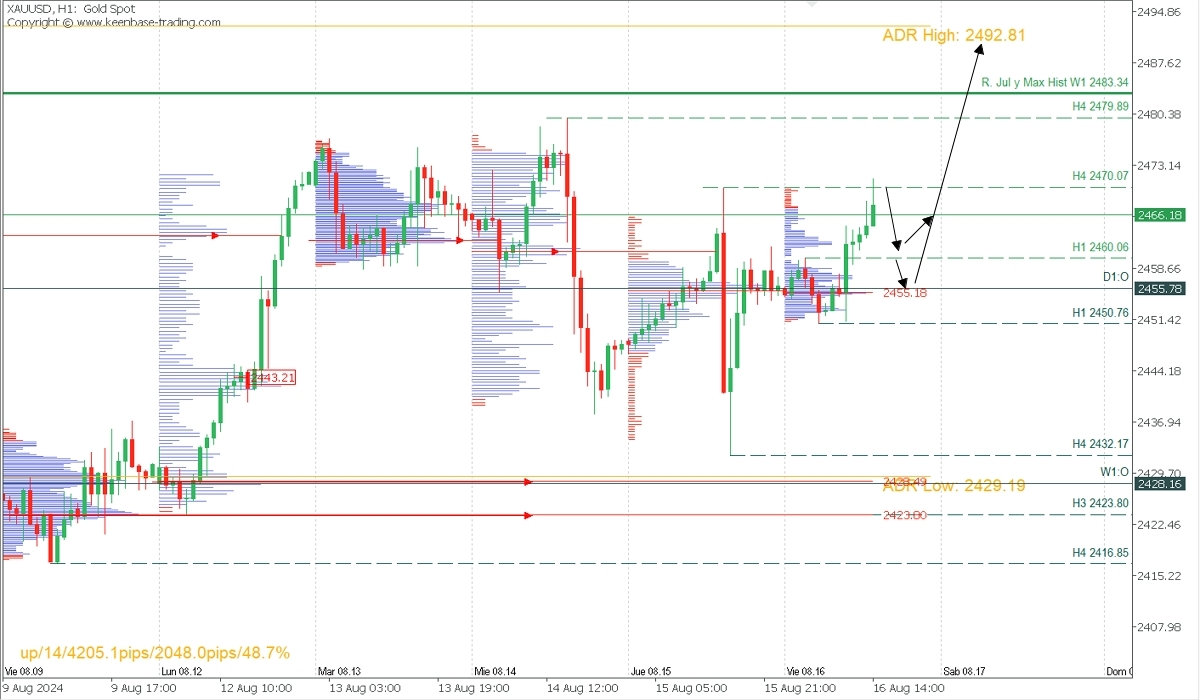
XAUUSD, H1
Supply Zones (Sell): 2473
Demand Zones (Buy): 2455.18, 2428.49, and 2423.80
The price shows signs of recovery after breaking local resistances at 2460 and 2470, suggesting a continuation of the macro bullish trend with a target at 2500 intraday and the potential for new all-time highs in the short term.
In this context, the breakout of a previous session’s resistance activates a corrective scenario, with targets at 2462, 2460, 2458, and 2456 in extension.
All these levels represent demand zones that could trigger buys towards 2473, 2480, 2483, and the average daily bullish range at 2492.81.
*Uncovered POC: POC = Point of Control: This is the level or zone where the highest volume concentration occurred. If a downward move follows this level, it is considered a sell zone and forms a resistance area. Conversely, if an upward move follows it, it is considered a buy zone, usually located at lows, forming support zones.